
2.1. Groundwater Systems#
Water Demand#
The UK has a high demand for water, on the order of \(150 \ \mathrm{l}\) per day, per person. Of this, about 33% is used for toilets, and another 33% is showers, dishwashers and drinking (the bit that needs to be potable, or clean). Certain parts of the UK are under severe water stress, particularly in the south east, where rainfall is the lowest and population density is the highest.
But in addition to turning on the tap and using water for our regular ‘domestic’ life, many of the everyday products that we use all the time have a large water footprint. A water footprint refers to the total amount of water that it takes to make something. You can see the water footprint of some common foods in Fig. 2.1, and in the lecture we will step through the water footprint to make one cup of coffee.
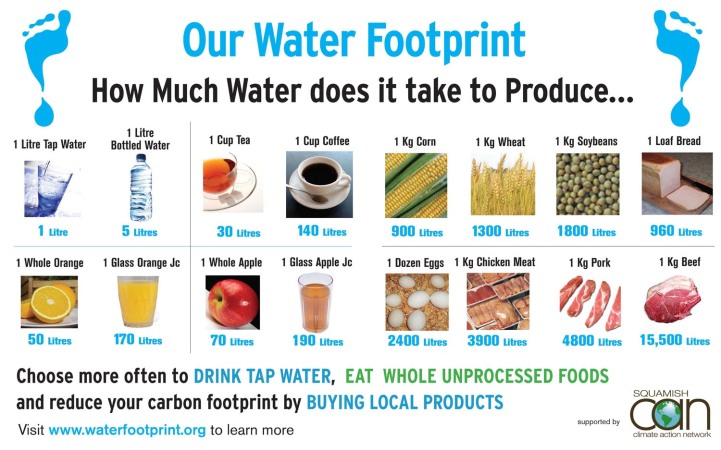
Fig. 2.1 The water footprint of various sundry goods. Image based on The water needed for the Dutch to drink coffee by Chapagain and Hoekstra (2003).#
Groundwater#
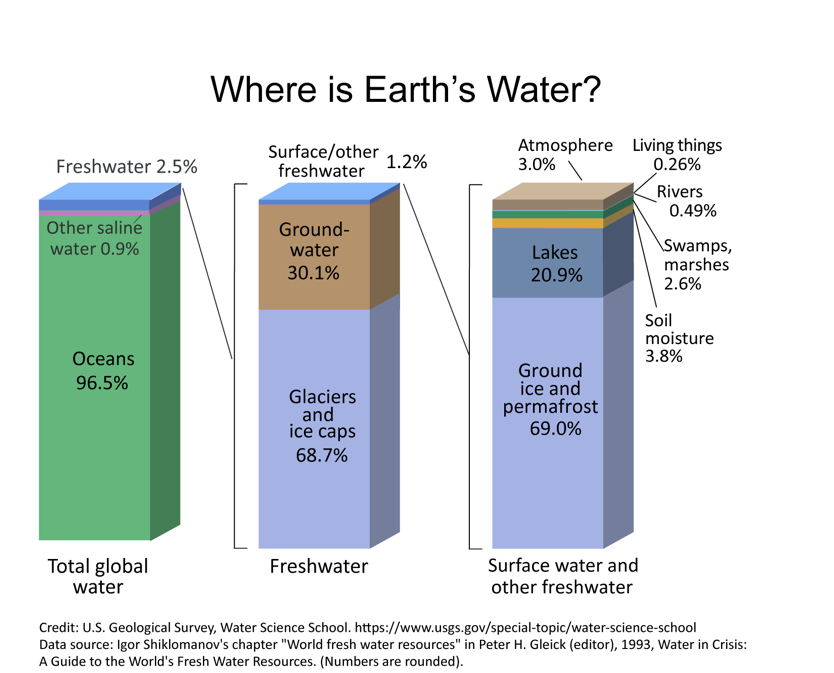
Fig. 2.2 The distribution of water on earth. Left, all water. Middle, fresh water. Right, surface water.#
Roughly 30% of Earth’s fresh water is in groundwater (Fig. 2.2), with most of the rest tied up in glaciers. How does water get into the ground? Rain falls down on the ground, and approximately 30% of it returns to the atmosphere via evaporation, 30% returns to the atmosphere via transpiration (these are lumped together often as evapotranspiration), and 30% runs off the land through streams and rivers (which you’ll learn more about in the Surface Water section). The balance of these processes will clearly differ all over the planet depending on vegetation cover, temperature, climate, and soil type (among many other things). But approximately 10% seeps into the ground through a process called infiltration, or percolation (Fig. 2.3). This infiltration supplies water to the level beneath the surface below which the pore space (the space between the grains of soil or rock) is full of water, or saturated; the top of this saturated zone is called the water table. This process of infiltration of rainwater into groundwater is broadly termed recharge. Recharge is simply precipitation minus runoff and evapotranspiration.
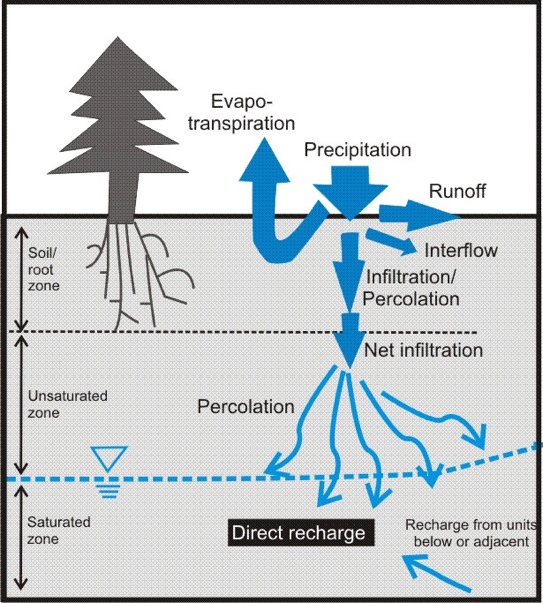
Fig. 2.3 A schematic showing the fluxes of water within, into and out of the groundwater system.#
Within groundwater systems, recharge brings water in, and discharge refers to where water is leaking out of the groundwater system. This can be into a body of water (stream, river, lake), or into the ocean (called submarine groundwater discharge), or directly onto land (springs and seeps). What drives groundwater to flow from recharge to discharge, and how might it evolve along this flow path?
Residence Times#
Similar to Lecture 2, we can consider a groundwater system as a reservoir (or box) and think about the supply of water to that box as the recharge and the removal of water from that box as the discharge and ask ourselves what is the residence time of water in groundwater (Fig. 2.4)? What we find is that the residence time is long, but covers a very large range. There is a small flux in terms of recharge and discharge, and a large volume, so the average residence time of groundwater is of the order of thousands of years. Shallow groundwater may be replaced within days to decades, while deep, isolated groundwater can have residence times of hundreds of thousands to millions of years.
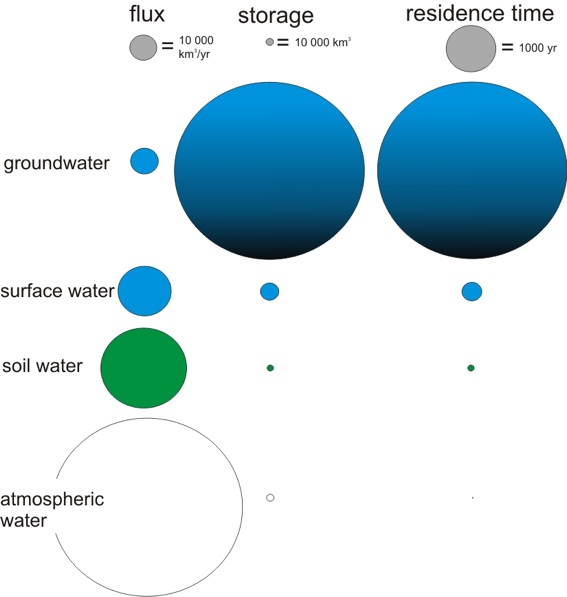
Fig. 2.4 The flux, capacity, and residence times for various water reservoirs on earth.#
We can verify this by measuring, or dating, the chemistry of groundwater. When groundwater was last in contact with the atmosphere it acquired a chemical signature (for example radiocarbon, tritium, or CFCs) that decays or changes in a predictable way as it flows through the ground.
It was through this chemical dating of groundwater that some scientists in Canada discovered that some groundwater has been buried and isolated from the atmosphere for billions of years, and that there is a vast amount of deep salty groundwater below the fresh surface groundwater that we are interested in for drinking, agriculture and all the other things for which we need water.
Fig. 2.5 shows the typical residence times for different types of groundwater systems. Please keep in mind that these residence times vary greatly for different environmental systems.
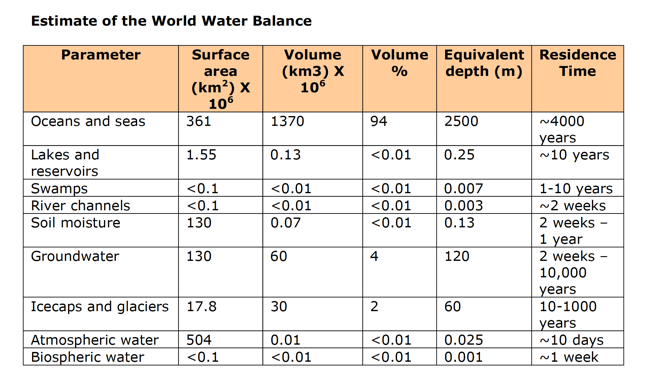
Fig. 2.5 This table, which was not in the lecture, gives a nice overview of where water is all over the surface and approximately how much time it spends in any one of those reservoirs.#
Aquifers#
As we consider groundwater systems, we can first think about the key vocabulary we use to describe them (we did this above with infiltration, and runoff, and water table). Aquifer comes from two Latin words for water (aqua) and bear (ferre) – and literally means water-bearing formation. It is the part of the ground below the water table where groundwater can not only exist, but there is enough space between the solid bits for groundwater to move. This is in contrast to an aquitard, which restricts (or retards – slows) water flow, which we often call a confining layer.
Porosity#
In general the water storage ability in an aquifer is controlled by the porosity. Porosity is the space between the grains of sand or particles of rock where water can exist. It is the fraction of the total volume that is void space:
In practice we rarely measure the void volume directly. Instead we measure the bulk density of a sample (\(\rho_{bulk}\), dry mass divided by total volume) and assume a density for the grains themselves (\(\rho_{grain}\), e.g. \(2650 \ \mathrm{kg \ m^{-3}}\) for quartz).
We didn’t talk about this in the lecture, but for additional knowledge, there are four things that control the porosity of a system where groundwater moves (Fig. 2.6):
Grain shape and packing
Grain-size distribution
Degree of compaction
Degree of cementation
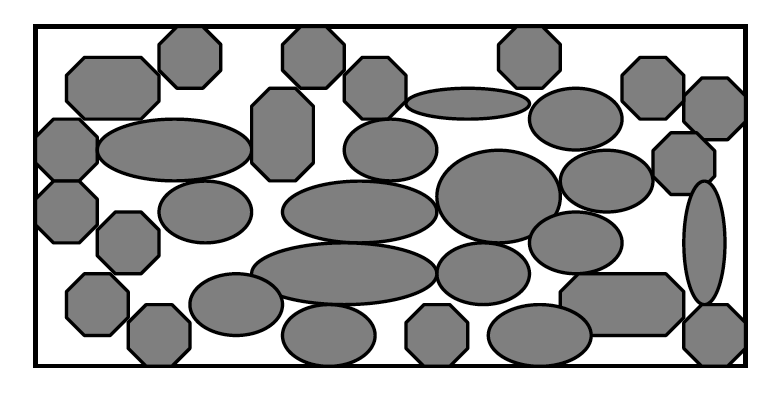
Fig. 2.6 A cartoon showing how porosity is controlled by grain geometry.#
In general, porosity ranges from 10 to 60% in most places where groundwater might be found. Perfectly uniform spheres with cubic packing have a porosity of ~48%. Most materials are less than that, because mixed grain sizes, compaction and cement fill some of the pore space. Clays can have higher porosity (40–70%) because their platy grains stack loosely, while crystalline rocks have very low porosity (often <1%), most of it in fractures.
Groundwater Continuity Equation#
We can derive the groundwater continuity equation, which will track the amount of groundwater in a particular area (\(S\)) more broadly in a similar way to how we did in the last lecture. This reiterates the importance of mass balance, that is the storage of groundwater in a particular area (\(S\)) is a function of the inputs of groundwater to that area and the outputs of groundwater from that area. In the case of groundwater, the inputs of water to the system come from precipitation (\(P\)) as well as groundwater that moves laterally in from another part of the region (\(G_{in}\) more on this in the next lecture!). The outputs are from evapotranspiration (\(E_{tp}\)), runoff (\(R\)) on the surface, and groundwater flowing out of the area (\(G_{out}\)). If we consider the amount that is stored in the groundwater for a particular area - often a watershed - (\(S\)), we get a mass balance equation similar to that used for the carbon cycle in the previous lecture.
Of these things, only \(P\) and \(R\) (precipitation and runoff) are routinely measured. The others are hard to measure over a whole catchment, so we usually estimate them with a model. We often assume steady state, which means that the amount in the groundwater (\(S\)) is not changing with time (it is always worth asking whether this is a reasonable assumption!). In that case \(\dv{S}{t} = 0\) and
Why Water Moves#
Inherent to the idea of a groundwater system is the idea that groundwater moves from a point of recharge to a point of discharge. If the total volume stored is a function of the porosity, then we can ask ourselves what controls how groundwater moves from one point to another point?
This was first explored in the 1850s by Henry Darcy, a French civil engineer, who set up a pipe filled with sand and played around with how fast water moved through the pipe (Fig. 2.7).
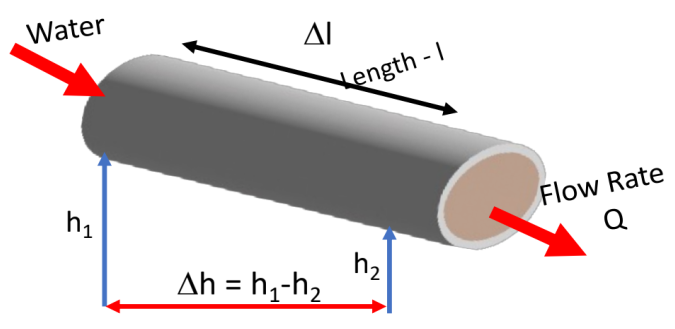
Fig. 2.7 A schematic of the original experiment by Henry Darcy.#
Here the pipe (length \(l\) and cross-sectional area \(A\)) was put at various angles to the horizontal (determined by \(\Delta h\) – or the height difference between one end of the pipe to the other end of the pipe) and the flow rate, \(Q\), was measured (in units of volume-per-time).
Specifically, we will call \(\frac{\Delta h}{\Delta l}\) – that is the change in height over a distance along the pipe - the hydraulic gradient. In this set-up both ends of the pipe are open to the atmosphere, so \(\Delta h\) is just the difference in elevation. In the next lecture we will see that, more generally, \(h\) is the hydraulic head, which also includes the pressure of the water.
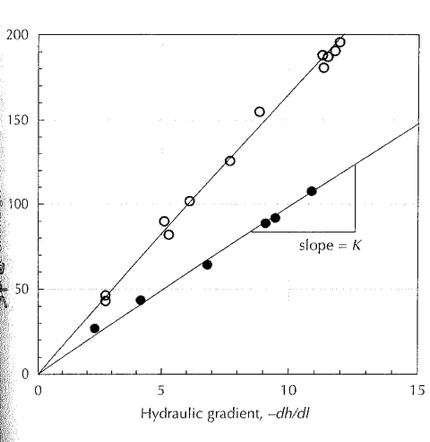
Fig. 2.8 Plot of Flow Rate \((Q)\) against \(-\dv{h}{l}\). The gradient gives \(KA\), the hydraulic conductivity multiplied by the pipe area.#
What Darcy found was that \(Q\) is proportional to \(\Delta h\) and inversely proportional to \(l\). That is the greater the drop between the start and end of the pipe (i.e. steepness, for a pipe of fixed length), the larger the volumetric flow rate, and the longer the pipe is the lower the volumetric flow rate. He also found that \(Q\) is proportional to \(A\), that is the larger the pipe, the larger the flow rate. When he filled the pipe with different material, he found that the slope (in a plot of \(Q\) versus \(\frac{\Delta h}{\Delta l}\), Fig. 2.8) changed. Because the slope also depends on \(A\), the property of the material itself is the slope divided by the area. We call this \(K\), the hydraulic conductivity.
Therefore, \(Q \propto - A \frac{\Delta h}{\Delta l}\), which we can turn into an equation using \(K\): \(Q = - K A \frac{\Delta h}{\Delta l}\). Or more generally:
which is known as Darcy’s law.