
2.2. Why water moves beneath the surface#
In the last lecture we derived the groundwater continuity equation, which described the balance of the sources and sinks of water within a groundwater system or watershed. This equation is the basis for global maps of groundwater depletion (Fig. 2.9). Groundwater depletion refers to the long-term loss of groundwater stored in subsurface aquifers because abstraction exceeds recharge.
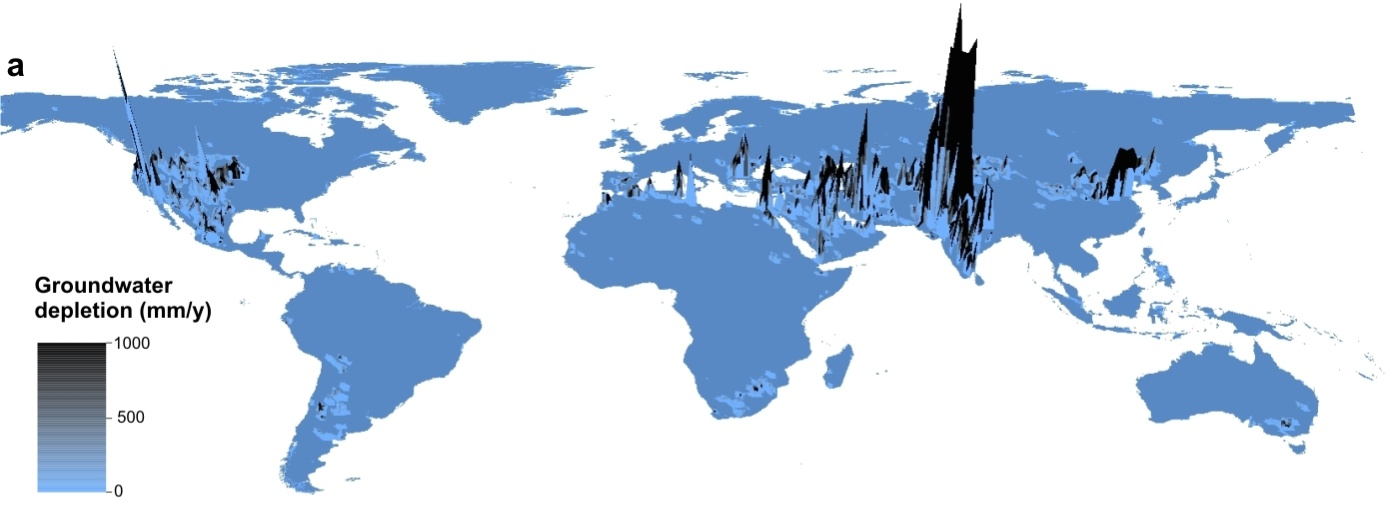
Fig. 2.9 A global map of groundwater depletion - peaks show areas where groundwater is most depleted.#
We can link the areas where groundwater is particularly depleted to areas where the groundwater footprint is particularly large relative to the size of the aquifer from which it is drawing water (Fig. 2.10).
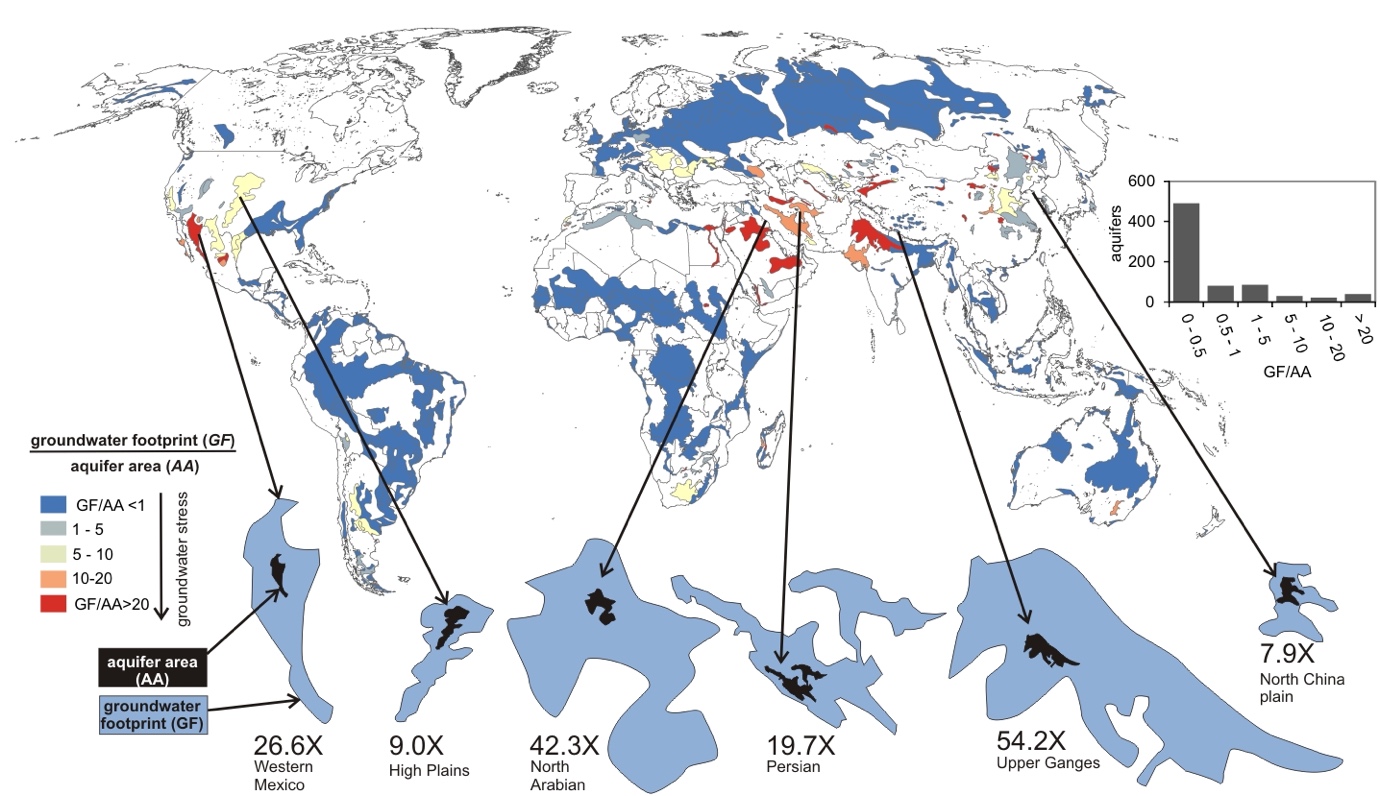
Fig. 2.10 Groundwater depletion is most severe where the ‘groundwater footprint’ is much larger than the underlying aquifer area.#
In the last lecture we also learned all about the various names for places that hold groundwater in the subsurface. This schematic summarises some of those key points and we will revisit it again. It gives a more clear view of confined aquifers and unconfined aquifers.
A confined aquifer has a confining layer above it which stops or slows (confines) the water in the groundwater system. An unconfined aquifer has no confining layer above it, so its upper boundary is the water table.
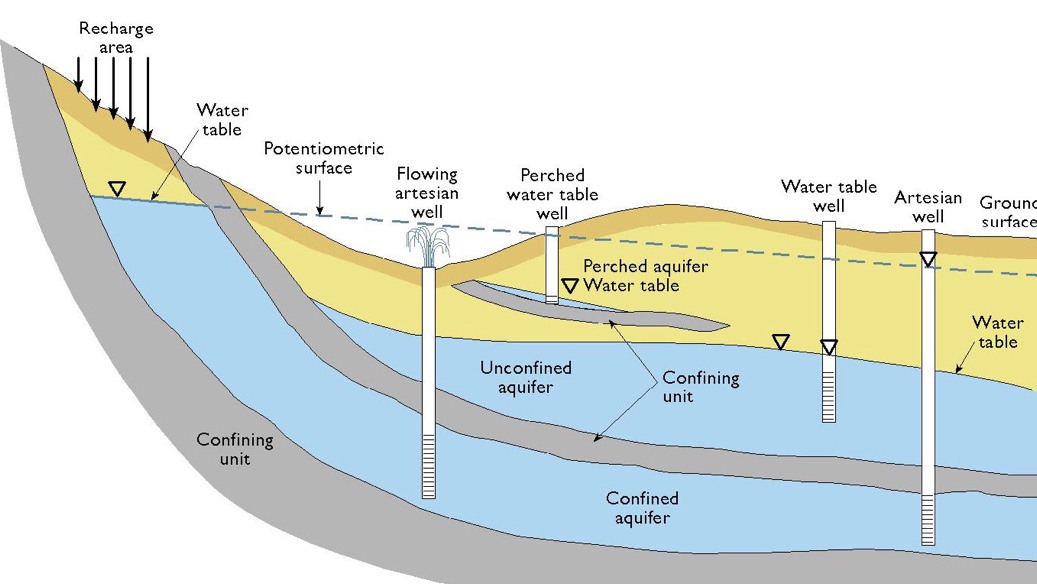
Fig. 2.11 Schematic figure showing the anatomy of different kinds of aquifer.#
In the schematic in Fig. 2.11, ‘confining units’ are aquitards, and the unconfined and confined aquifers are labelled. It should be clear that the residence time of water in a confined aquifer is much longer than it is in an unconfined aquifer. Furthermore, if we think about a toxic chemical spill at the surface, an unconfined aquifer will get more of the toxin leaking into it as it isn’t protected, whereas a confined aquifer often is protected from surface chemicals through the aquitard, or confining unit.
Sometimes the hydraulic head in a confined aquifer is higher than the top of the aquifer, and can even be higher than the ground surface. This is because the aquifer is recharged where it is exposed at a higher elevation, and the confining layer stops the water escaping upwards, so the water in the aquifer is under pressure. When a well is drilled into the aquifer, water rises up the well to the level of the potentiometric surface; if this is above the ground surface, the well flows without pumping. This is called an artesian well. This is shown on the figure as well.
The key goal of today’s lecture is to apply Darcy’s law from the lab to the environment and understand what a hydraulic gradient or conductivity is in the field.
In the last lecture we derived Darcy’s Law based on experiments done in the 1850s.
Where \(Q\) is the volumetric flow rate, \(K\) is the hydraulic conductivity, \(A\) is the cross-sectional area, and \(\dv{h}{l}\) is the hydraulic gradient.
Note that often you will see \(q\) rather than \(Q\) used where \(q\) is specific discharge, or Darcy velocity, and is the flow rate (\(Q\)) divided by the area (\(A\)):
Let’s learn more about this hydraulic conductivity – \(K\). We can derive that the units are length-per-time, or often \(\mathrm{m \ s^{-1}}\). Studies of actual groundwater systems have shown that it can range over 12 orders of magnitude in various materials below the surface (Fig. 2.12).
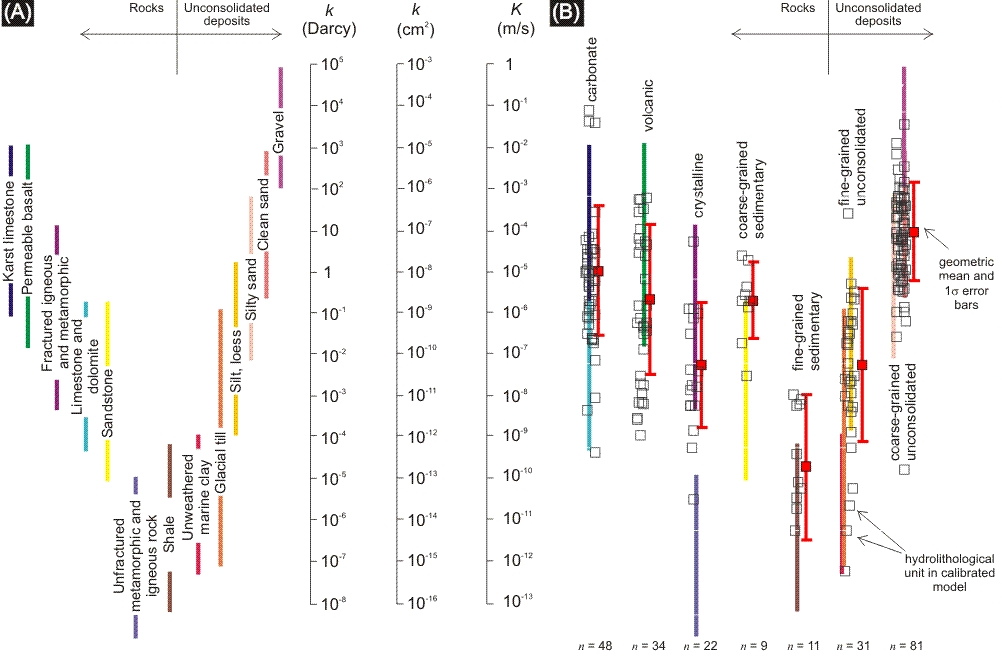
Fig. 2.12 Comparing hydraulic conductivity values from (A) Freeze and Cherry (1979) and (B) calibrated regional scale hydrogeologic models. Each open square is an optimised or mean value from a part of a model domain that is larger than \(5 \ \mathrm{km}\) horizontally. Values are grouped into hydrolithologic categories that are typical for regional-scale modelling (e.g. fine grained, unconsolidated). The geometric mean is shown as a red square with \(1\sigma\) standard deviation for each hydrolithologic category.#
Hydraulic conductivity is a function of both the medium (what groundwater flows through) and the fluid that is going through the medium (usually water, in the case of groundwater). \(K\) is:
Here, \(Cd^2\) is a property of the medium – where \(d\) is the diameter of the grains, and \(C\) is a constant of proportionality, which covers grain packing, how round the grains are, how much cement is around. Meanwhile, \(\frac{\rho g}{\mu}\) is a property of the fluid, with \(\rho g\) being the specific weight of the fluid (\(9800 \ \mathrm{N \ m^{-3}}\)) in the case of water and \(\mu\) being the dynamic viscosity of the fluid (\(1.386 \times 10^{-3} \ \mathrm{N \ s \ m^{-2}}\) for cool groundwater).
While hydraulic conductivity is a function of the medium and the fluid (imagine trying to put honey through a groundwater system!), in reality, as for most groundwaters the specific weight and dynamic viscosity vary little, what is important is the soil/rock/subsurface (medium) through which you are trying to push groundwater. Mathematically, we denote this \(k\) – and it is known as permeability.
We can relate hydraulic conductivity (units \(\mathrm{m \ s^{-1}}\)) to permeability (units \(\mathrm{m^2}\)) by combining Eqs. (2.6) and (2.7):
If we assume that the fluid flowing through the groundwater is water, \(\frac{\rho g}{\mu}\) is effectively a constant. This is usually a safe assumption (even really salty brines in groundwater systems have a specific weight and dynamic viscosity that means they behave more or less as water). If you read around a bit you will also find a unit of permeability called the ‘darcy’, which is widely used in the oil and gas industry.
Fig. 2.12 compares hydraulic conductivity values from a classic compilation of measurements with those from calibrated regional hydrology models. This gives you a sense of the hydraulic conductivity associated with different types of material that we find beneath the surface of the planet. Fig. 2.13 shows a map of the global distribution of permeability which often relates to the underlying rock type. In the lecture we will introduce the concept of Transmissivity (\(T\)), which is the hydraulic conductivity multiplied by the saturated thickness of the aquifer (\(b\)): \(T = Kb\).
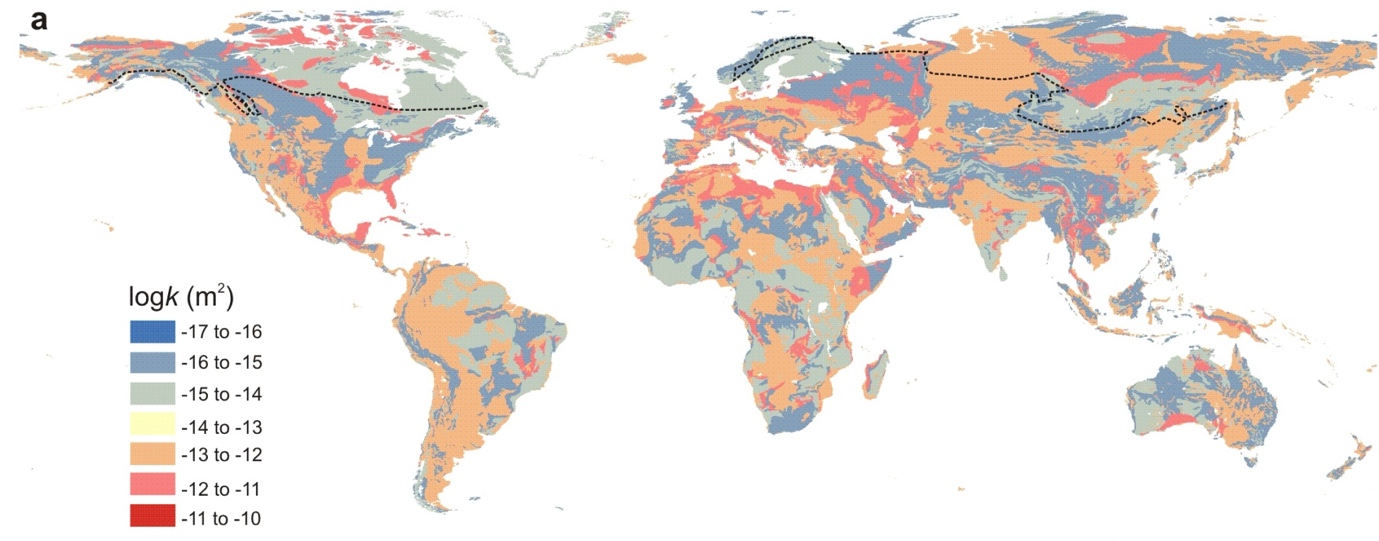
Fig. 2.13 The global distribution of permeability in \(\log(k \ / \ \mathrm{m^2})\). The regional scale permeability will be much lower in the regions north of the dashed continuous permafrost line. Smaller continuous permafrost areas in mountainous terrain are not shown.#
Darcy’s Law provides us with a nice study of what controls the rate that water flows through porous media. But like all laws it rests on a few assumptions. We need to understand these assumptions before we take the flow through the pipe and translate it to the flow through an actual groundwater system. One of the main assumptions is that flow is laminar, and not turbulent (Fig. 2.14).
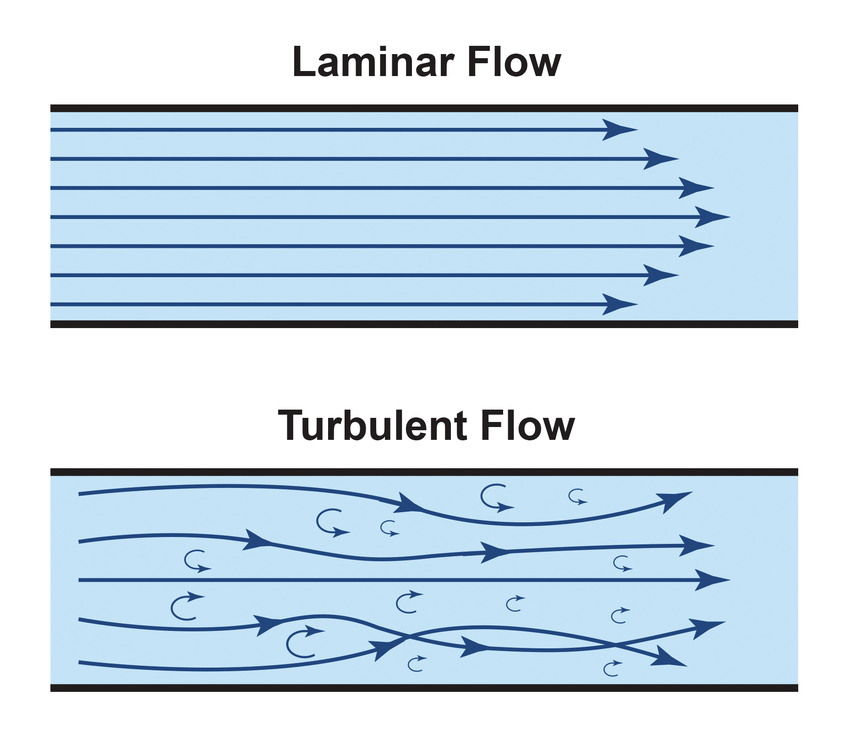
Fig. 2.14 Cartoon of the difference between turbulent and laminar flow.#
Laminar means that water is moving in the same direction, like a line, while turbulence occurs when there are deviations from this linearity of movement.
What was seen was that the nice linear relationship inherent to Darcy’s law broke down at high hydraulic gradients, such that \(Q\) no longer scaled linearly with hydraulic gradient (Fig. 2.15).
This is because turbulence has begun in the flow through the porous medium. Turbulence causes pressure loss and thus changes the flow rate.
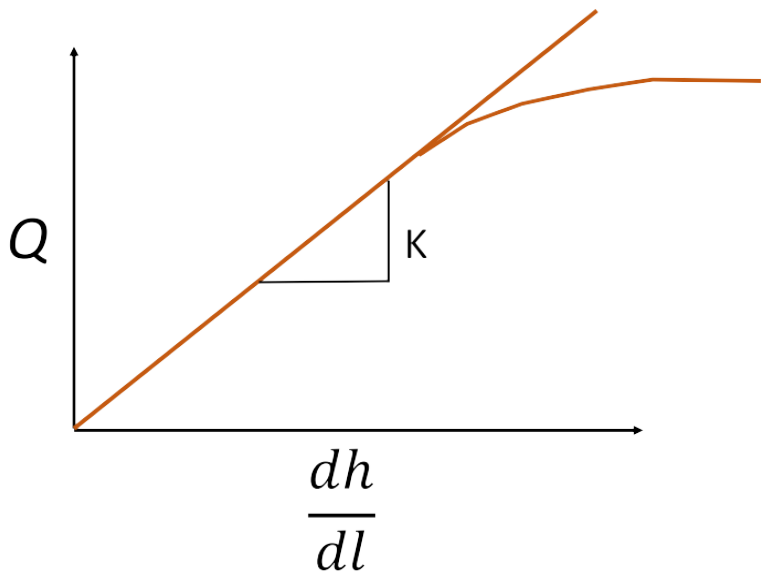
Fig. 2.15 Plot of flow against hydraulic gradient showing the branching of the flow regime. The lower branch represents the turbulent regime, where pressure is lost.#
We know if we are in a laminar versus a turbulent flow regime by calculating the Reynolds Number.
Where \(\rho\) is the density of the fluid, \(v\) is the velocity of the fluid, \(d\) is a length term, typically the grain size, and \(\mu\) is the dynamic viscosity of the fluid. Darcy’s law holds when \(\mathrm{Re}\) is less than about 1–10. Above this the relationship between \(Q\) and the hydraulic gradient becomes non-linear, at first because of inertial effects in the pores, and at higher \(\mathrm{Re}\) (around 100 and above) because the flow becomes fully turbulent. Lucky for us, most groundwater systems have very low \(\mathrm{Re}\) and fall in the laminar, linear (Darcy) regime.
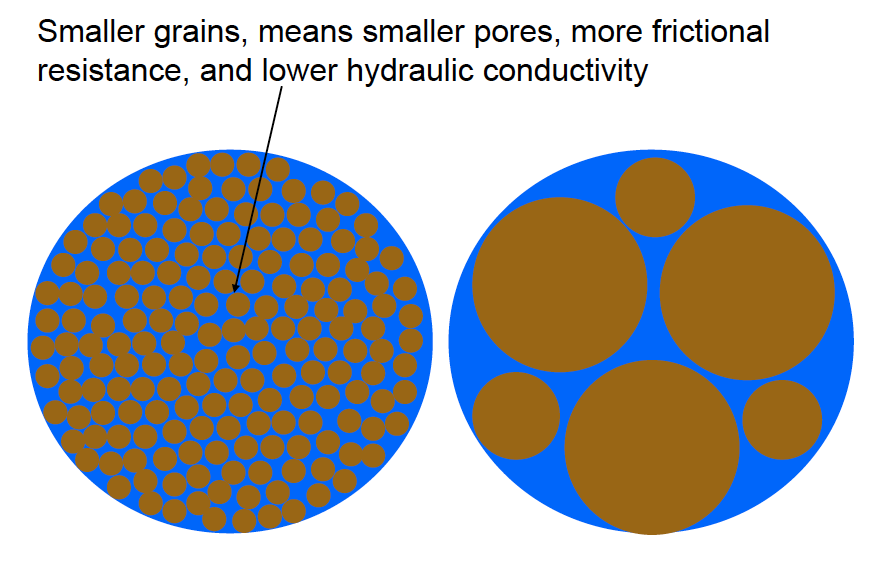
Remember that the grains in the porous media, more generally, provide frictional resistance to the flow (Fig. 2.16). Thus, the velocity of groundwater will be near zero at the interface between the flowing groundwater and the grains, and will be fastest in the middle between the grains. Fundamental properties of the rock/soil/sand have a massive impact on the overall operation of the groundwater system.
Let’s return to groundwater flow. What comes out of Darcy’s law is that the hydraulic gradient, that is \(\frac{\Delta h}{\Delta l}\) drives the flow of water through the pipe, or in case of the real world, the groundwater system. The porous medium (the grains of sand, or sides of the minerals in the rock) resist the flow, providing frictional resistance to the movement of water. The average groundwater velocity, or average linear velocity, is given by \(v = \frac{q}{n_e}\) where \(q\) is the specific discharge (\(\frac{Q}{A}\)) and \(n_e\) is the effective porosity (the fraction of the rock made up of connected pores that water can flow through). The average groundwater velocity \((v)\) is always greater than the specific discharge, because water can only flow through the pores, which are only a fraction (\(n_e < 1\)) of the cross-sectional area.
We can now think about how this might look in the real world.
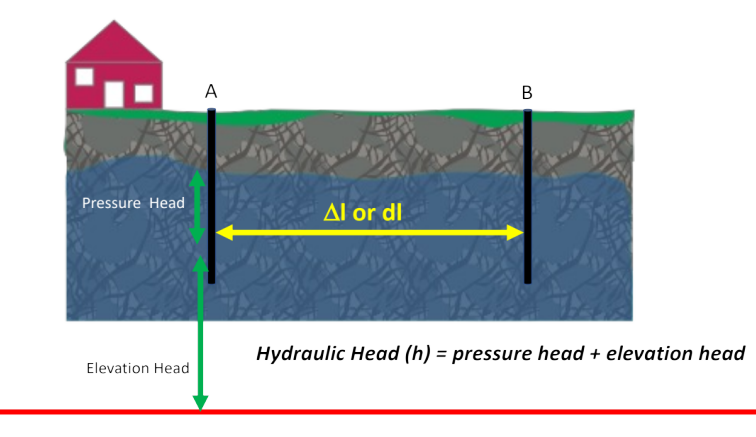
Fig. 2.17 Schematic showing the calculation of hydraulic head.#
If we think about a groundwater system with two wells (Fig. 2.17), the level that water rises to in each well tells us the hydraulic head at the bottom of that well. Hydraulic head is the total mechanical energy per unit weight of water at a point, expressed as a height (in metres) above a reference level, or datum, often sea level. It is the sum of the elevation head (\(z\), the height of the point above the datum) and the pressure head (\(\frac{P}{\rho g}\), the height of the column of water that the pressure at that point would support):
Strictly there is also a velocity head (\(\frac{v^2}{2g}\)), from the kinetic energy of the moving water, but groundwater moves so slowly that we ignore it.
The change in the hydraulic head (\(\dd{h}\) or \(\Delta h\)) over a fixed distance (\(\dd{l}\), or \(\Delta{l}\)) is the hydraulic gradient. This is what drives the water to flow through the porous media (in this case, the rock).
Conceptually, water flows from high hydraulic head to low hydraulic head, following the hydraulic gradient. Because head combines both pressure head and elevation head, this does not always mean flowing from high pressure to low pressure, or downhill: water can flow towards higher pressure head (e.g. downwards in a recharge area) or upwards against gravity (e.g. in an artesian well), as long as the total hydraulic head decreases along the flow path. This means there is a loss of head along the flow-path in a groundwater system. This loss of head amounts to a loss of mechanical energy from the system. But remember, energy must be conserved; it cannot be either created or destroyed. The mechanical energy is dissipated as heat by friction, as the water squeezes through the rock matrix. The high specific heat capacity of water, however, means that we can’t always measure a change in temperature associated with this conservation of energy.