3.1. Ice in the polar regions#
Glaciers and polar ice sheets#
Much of the world’s freshwater is contained in mountain glaciers, ice caps and in ice sheets which form through the accumulation and seasonal persistence of ice at high elevations and/or at high latitudes. In many parts of the world, mountain glaciers provide a significant source of drinking water (for example the Himalayas), but the response of these mountain glacier systems to a changing climate presents a significant environmental hazard. A much larger volume of ice is stored in ice caps (e.g. Iceland) and in the large polar ice sheets. These are the Antarctic ice sheet, which straddles the South Pole, and the Greenland ice sheet, slightly south of the North Pole and the Arctic ocean.
Glaciers, ice caps and ice sheets gain mass by the accumulation of snow at high latitudes or in cold seasons. This snow compacts under its own weight, squeezing the snow crystals together to form polycrystalline, glacial ice and expelling the majority of the air. However, some small quantity of this air gets trapped as air bubbles, along with airborne impurities, within the ice matrix. This process continues year-on-year, thereby providing a record of past climate variability as recorded in the ice core record and is one of the principle means we have to understand past climate variability over 100,000 year timescales (the longest ice core records climate variations greater than 800,000 years before present).
The accumulation of a sufficient weight of ice drives the flow of the ice, through viscous creep or by sliding along its base. Mass gained by snow accumulation is therefore transported to lower elevations and latitudes where it is more prone to melting. Some glaciers melt or terminate on land, while others flow out onto the ocean where they are discharged as icebergs. Some large ice sheets, for example the Antarctic ice sheet, flow onto the ocean as large floating ice shelves before they break up into icebergs.
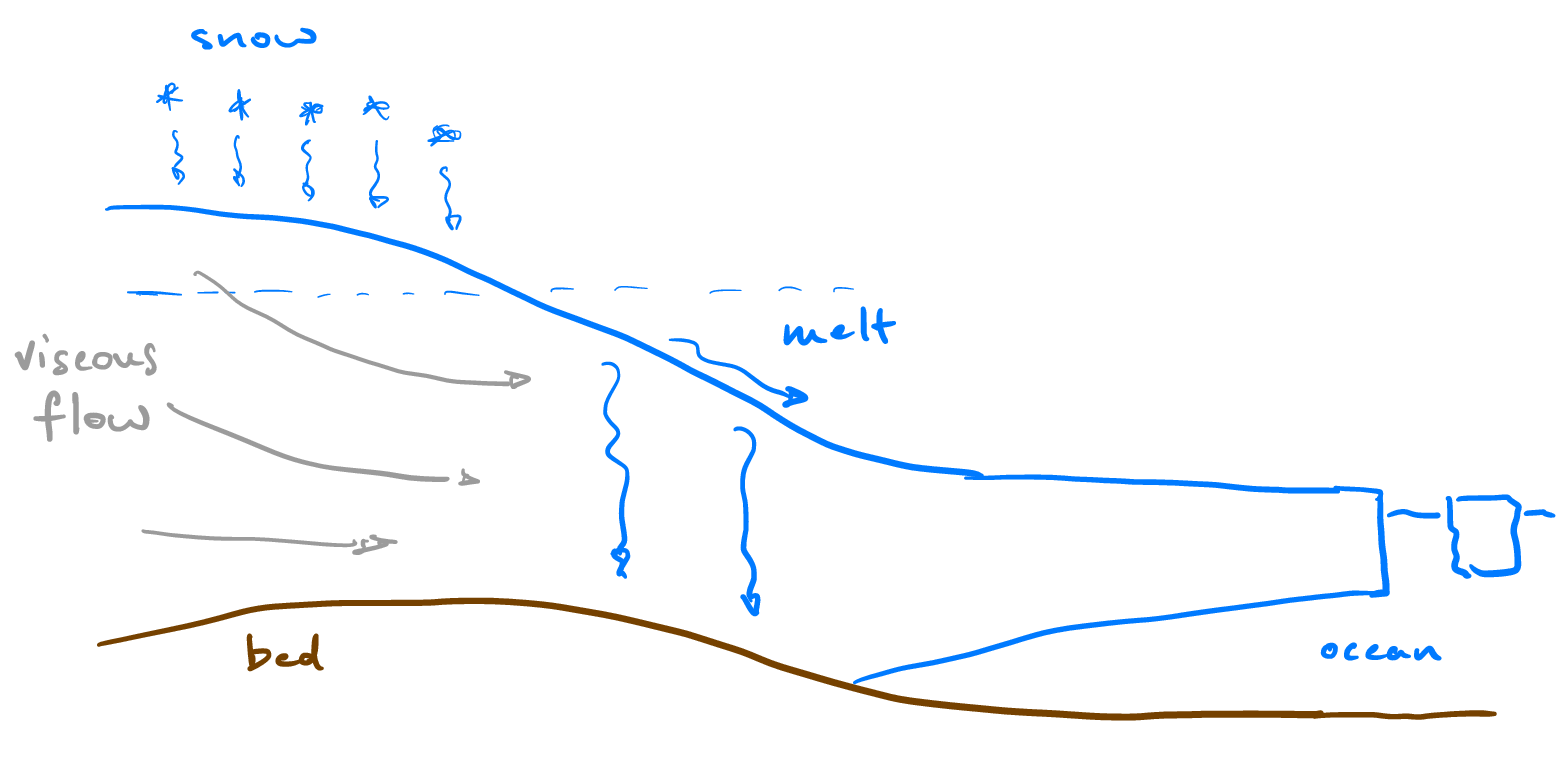
Fig. 3.1 Schematic of a glacier, ice cap or ice sheet.#
Glaciers and ice sheets are now measured through a wide variety of methods, both in situ and remotely. Early measurements of the velocity of ice sheets was through painstaking photography of stakes in the ice. More modern methods involve using Interferometric Synthetic Aperture Radar (INSAR) and feature tracking from satellite images to measure the altimetry of ice sheets and their surface velocities. In general, typical measured speeds of glaciers are typically \(100 \ \mathrm{m \ yr^{-1}}\), but with top speeds in excess of \(1000 \ \mathrm{m \ yr^{-1}}\). The flow velocity of the ice depends on the viscosity of the ice (which is a strong function of temperature) and the conditions at the base of the ice. Flow over wet rock or water saturated sediments reduce friction and hence accelerate ice velocities.
The mass of a glacier increases due to accumulation of snow, but is lost principally through melting and ice export (through viscous flow) into the ocean. Mountain glaciers (for example in the Alps or the Himalayas) are typically \(100\)s of metres deep and \(10\)s of kilometres in extent. Individually they therefore account for little ice mass, but their total is substantial. Glacial ice is currently estimated to have a volume of roughly \(V_g \simeq 170\, 000\ \mbox{km}^3\). For ice with a density of \(\rho_i = 917\ \mathrm{kg \ m^{-3}}\) that gives an estimated total mass of \(M_{g} \simeq V_g \rho_i = 116,000 \ \mathrm{Gt}\) where \(1 \ \mathrm{Gt} = 10^{12} \ \mathrm{kg}\). The current estimated mass loss rate for ice sheets is \(\dv{M_g}{t} \simeq 230 \ \mathrm{Gt \ yr^{-1}}\). At this rate, all mountain glaciers will have disappeared in the next 500 years (or less, as this mass loss rate is accelerating).
In contrast, the polar ice sheets cover immense areas and are 2-3 kilometres thick. For example, Greenland is roughly \(A_G \simeq 1100 \times 2900 \mathrm{km^2}\) and roughly \(h_G \simeq 2-3 \mathrm{km}\) thick. For ice with a density of \(\rho_i = 917 \ \mathrm{kg \ m^{-3}}\) that gives an estimated total mass of \(M_{G} \simeq A_G h_G \rho_i \simeq 3.1 \times 10^6 \ \mathrm{Gt}\). The mass loss from the Greenland ice sheet can be estimated by repeat satellite measurements of gravity above the ice sheet (the GRACE and GRACE follow-on missions) and is currently approximately \(\dv{M_G}{t} \simeq 280 \ \mathrm{Gt \ yr^{-1}}\), though that number is accelerating. This suggests a timescale for the complete loss of the Greenland ice sheet of approximately \(10,700\) years.
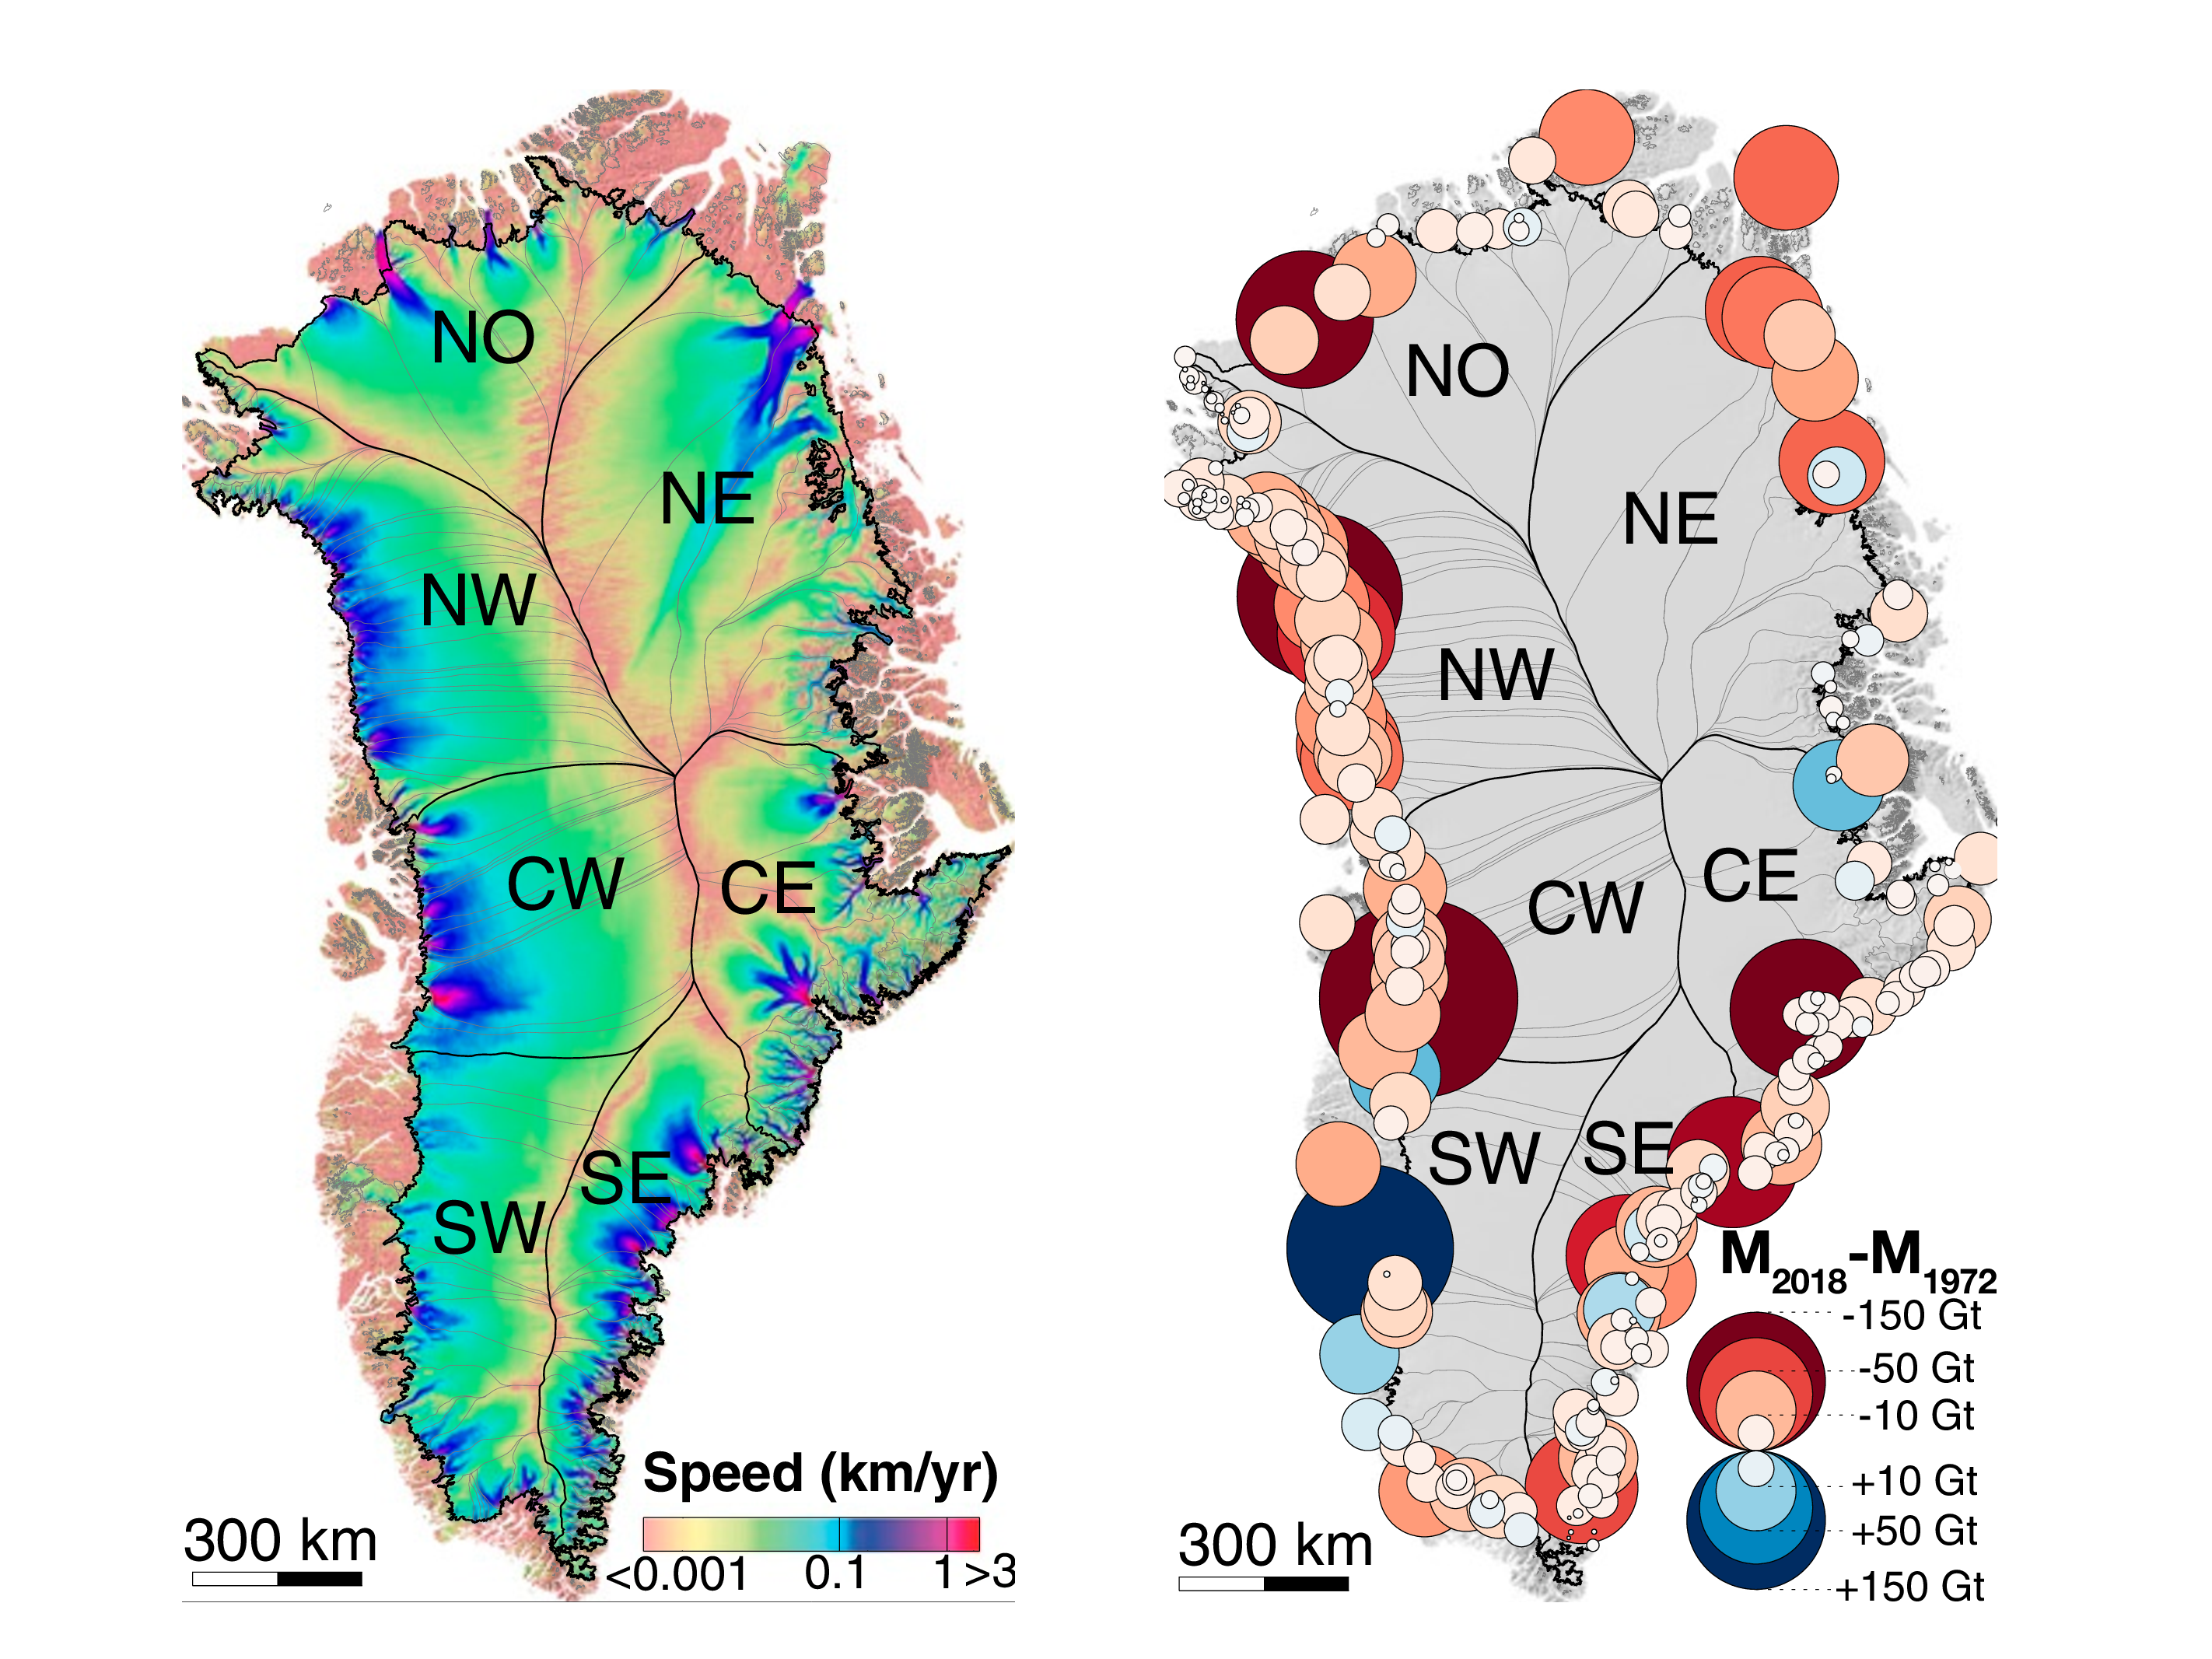
Fig. 3.2 The velocity and change in mass (2018-1972) of the Greenland ice sheet (Mouginot et al, PNAS 2019).#
In comparison, the Antarctic ice sheet is approximately \(R \simeq 2250 \ \mathrm{km}\) in diameter and roughly \(h_A \simeq 2 \ \mathrm{km}\) thick. Hence the mass of the Antarctic ice sheet is roughly \(M_A \simeq \pi R^2 h_A \rho_i \simeq 26 \times 10^6 \ \mathrm{Gt}\). With an estimated, current mass loss rate of \(dM_A/dt \simeq 150\ \mathrm{Gt yr^{-1}}\) this suggests a timescale for the complete loss of Antarctic ice of approximately \(104,000\) years.
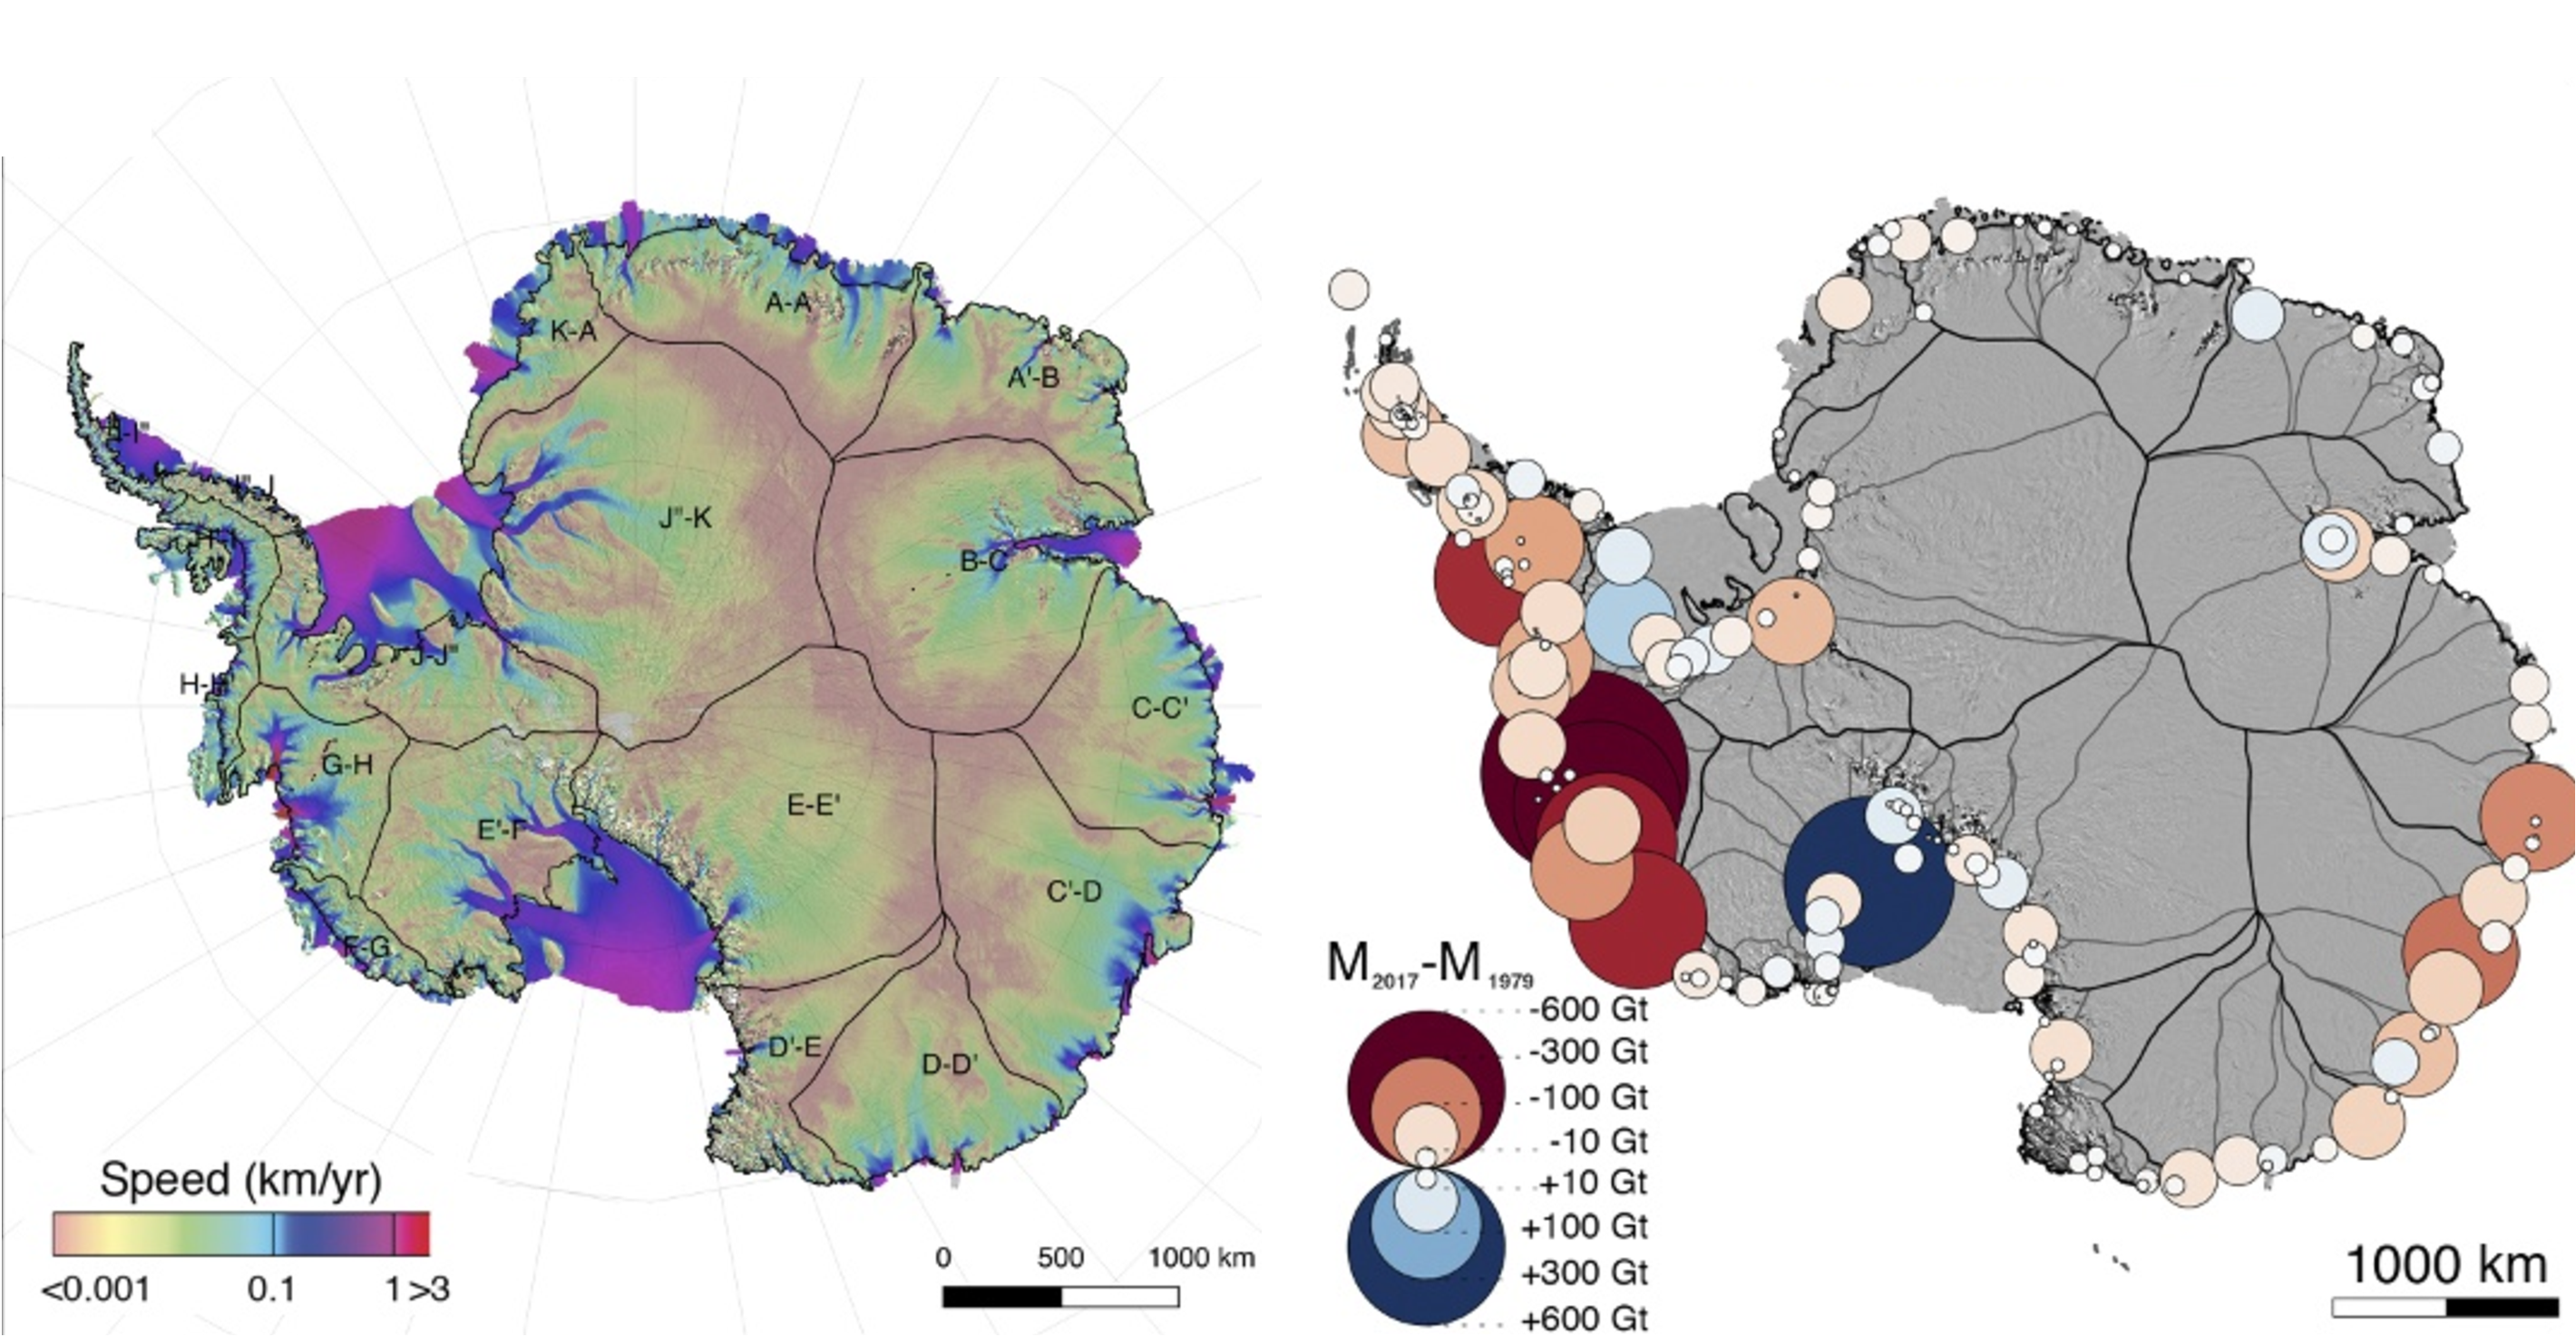
Fig. 3.3 The velocity and change in mass (2017-1979) of the Antarctic ice sheet (Rignot et al, PNAS 2019).#
Sea level rise#
An important implication from the melting of glacial ice and the polar ice sheets is rising sea levels. Global mean sea level has been rising at approximately \(3.4 \ \mathrm{mm \ yr^{-1}}\) since 1993, with indications that the rate is increasing. Sea level changes are principally driven by three processes. First, ice is transported from mountain glaciers, ice caps and ice sheets to the ocean, either as meltwater or by the flow of glacial ice (as soon as the ice is floating it is contributing to sea level change). Secondly, the temperature of the worlds oceans is increasing, and this drives thermal expansion which results in sea level rise. Thermal expansion drives an increase in ocean depth of approximately \(1.3 \mathrm{mm \ yr^{-1}}\). Third, water may be stored or released on land, for example due to changes in the groundwater table or by retention by dams. Together, the signal of land storage and ice export contribute to a changing mass of the oceans, which is equivalent to an increase in water mass by approximately \(2.1 \ \mathrm{mm \ yr^{-1}}\) sea level increase.
Sea ice extent#
The formation and decay of sea ice in the polar oceans is important, not only for the local indigenous populations as well as the ecological communities which populate the icy waters, but the formation and decay of sea ice is also an sensitive indicator of climate change in the high latitudes. Each winter, as the solar radiation decreases and temperatures in the high latitudes fall, the ocean freezes. The seasonal extent of the sea ice is highly influenced by the local geographical distribution of land and water masses. In the Arctic ocean, which is ringed by large land masses, inter-annual sea ice variations are roughly \(6 \times 10^6\ \mathrm{km^2}\). In contrast, the growth and decay of sea ice in the southern ocean is largely unconstrained, and proceeds from the Antarctic continent into the Antarctic Circumpolar Current (ACC). Inter-annual sea ice extent varies by roughly \(16 \times 10^6 \ \mathrm{km^2}\) around Antarctica. While the maximum and minimum Antarctic sea ice extents appear to be largely unchanged over the past 4 decades of observations, the Arctic sea ice extent has been decreasing rapidly. For example, the maximum Arctic sea ice extent is declining at roughly \(0.75 \times 10^6 \ \mathrm{km^2 \ decade^{-1}}\).
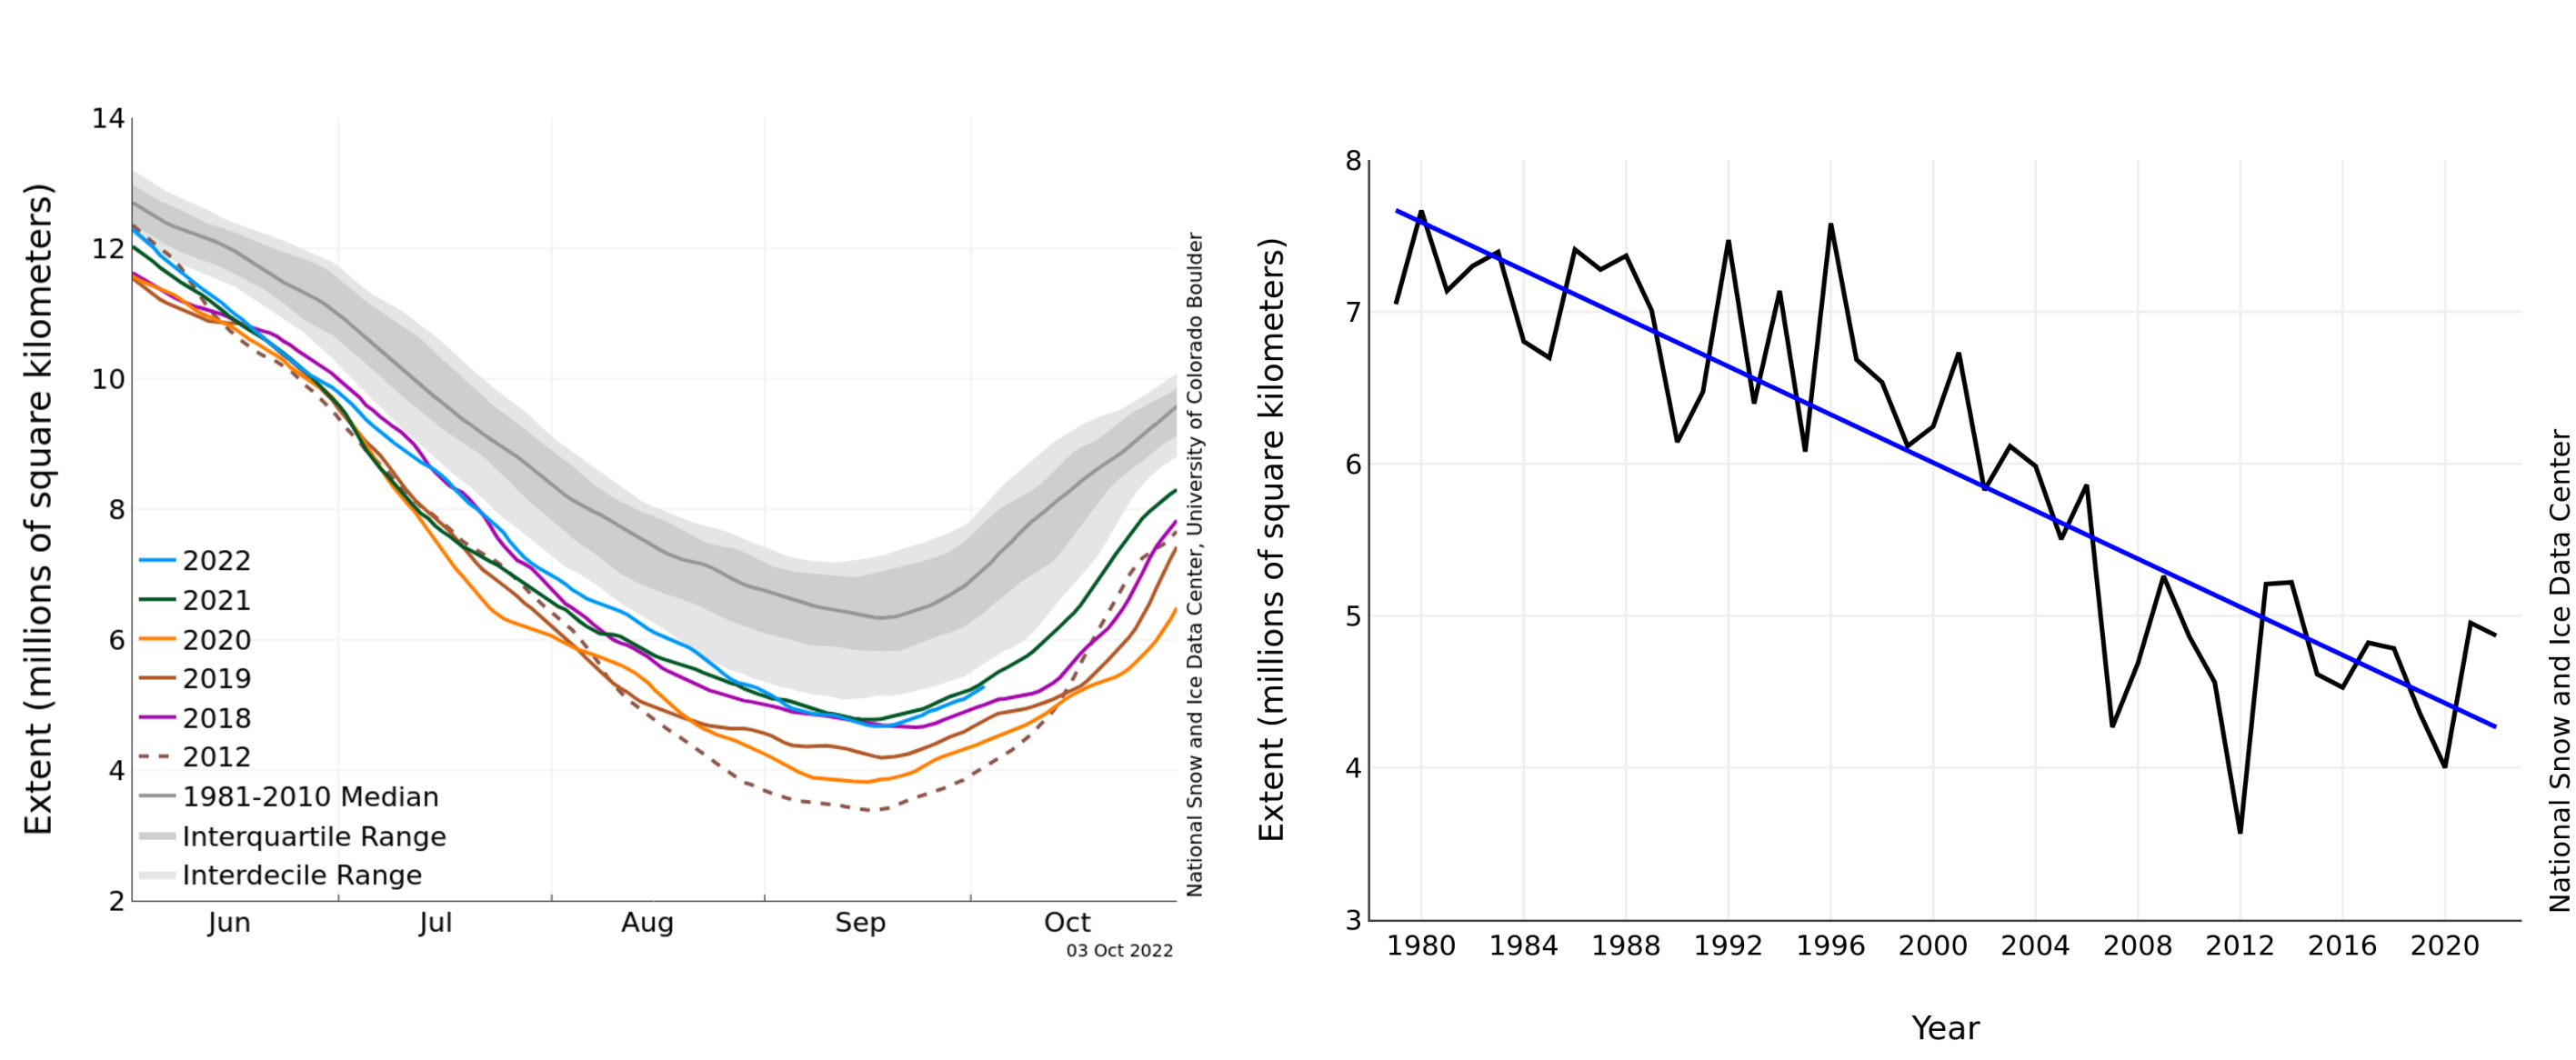
Fig. 3.4 Annual Arctic sea ice extent (area of ocean with at least 15% ice cover), and average September monthly ice extent (1979-2022)(NSIDC).#
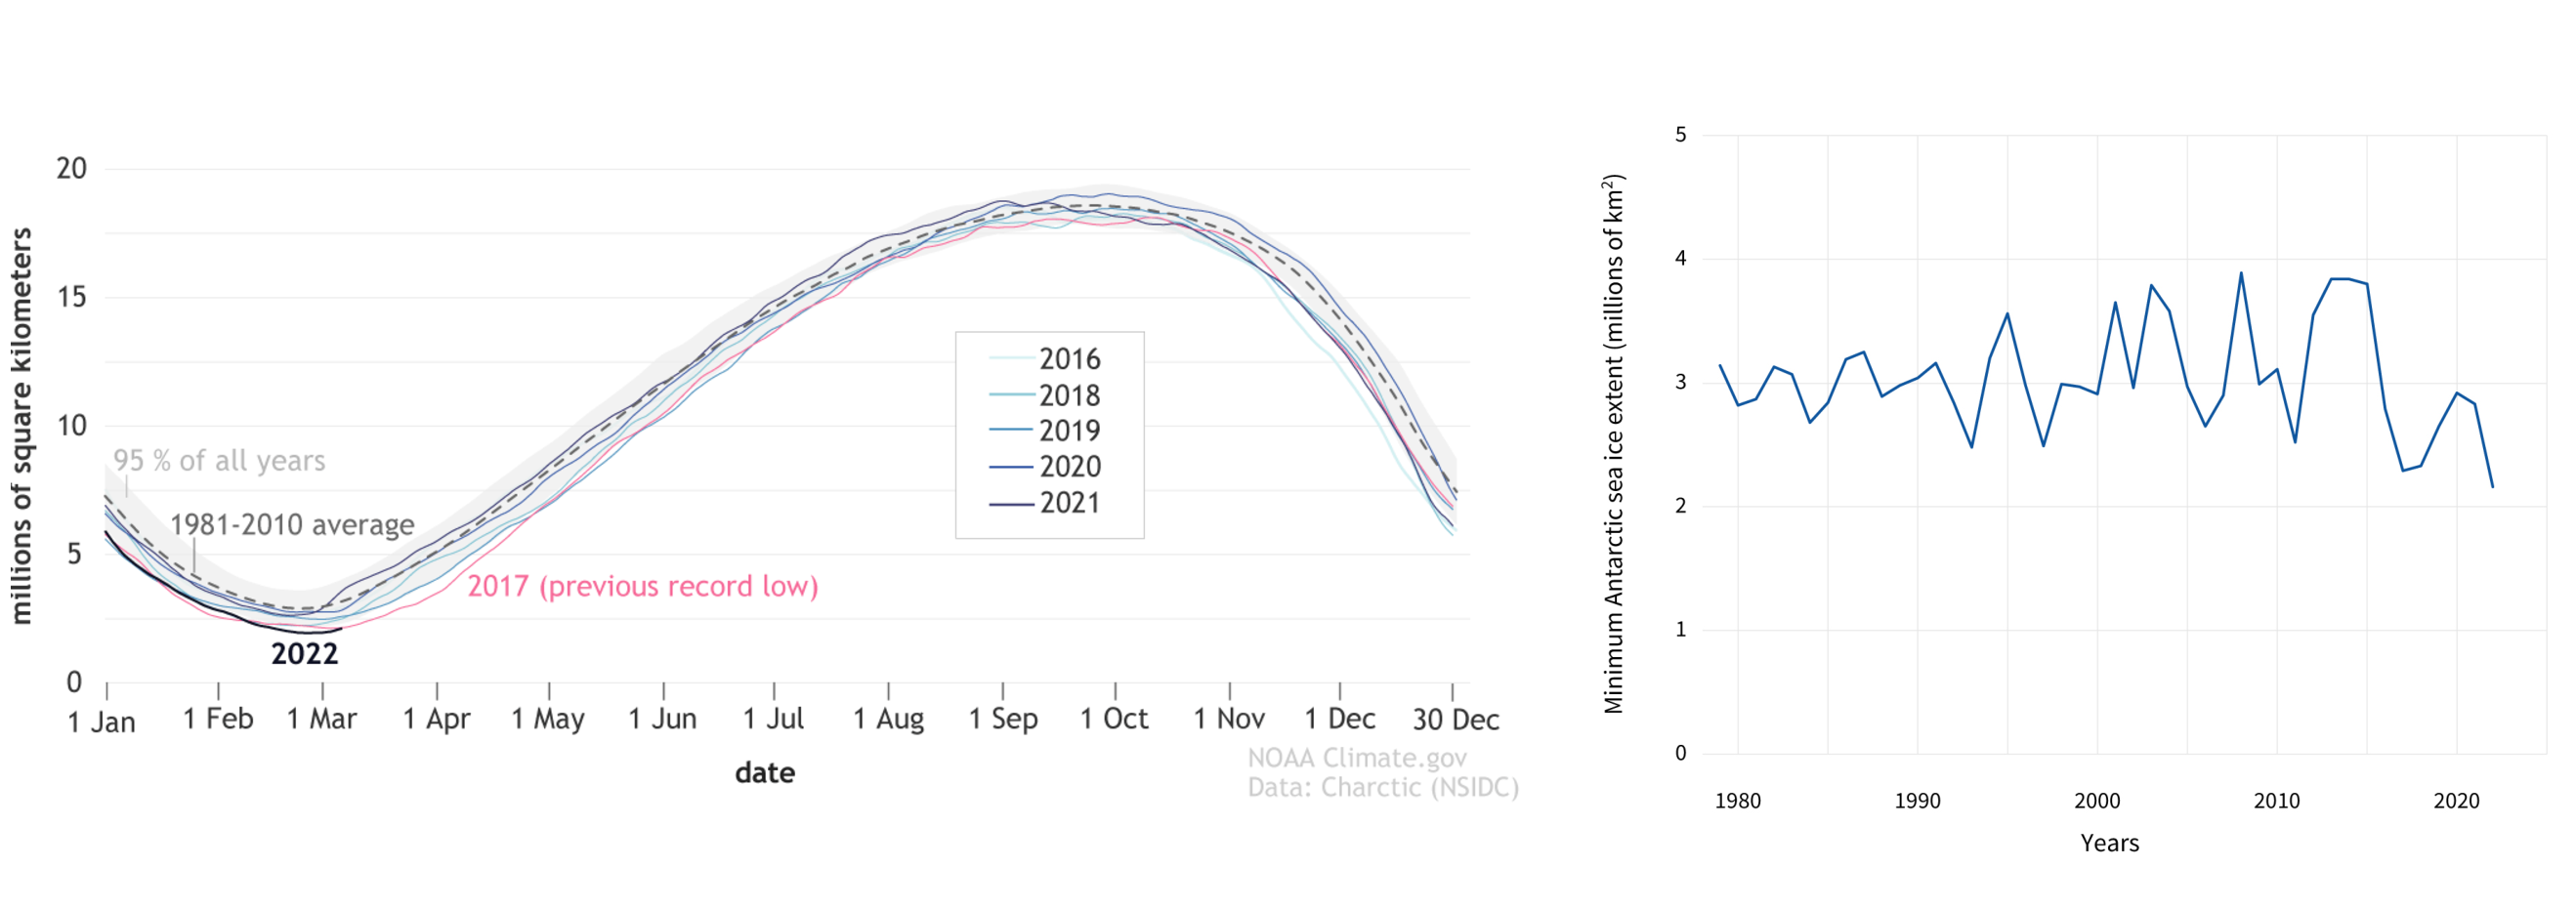
Fig. 3.5 Annual Antarctic sea ice extent (area of ocean with at least 15% ice cover), and minimum annual ice extent (1979-2022)(NSIDC).#
Ice albedo feedback#
An important implication of the annual variability of the Antarctic and Arctic sea ice extents, and the precipitous decline in Arctic sea ice extent is the radiative impact of sea ice. The proportion of incoming solar radiation that is reflected is called the albedo. For completely absorbing surfaces the albedo is \(0\), while for totally reflective surfaces the albedo is \(1\). Relatively bright, white snow and sea ice has an albedo of roughly \(0.8\), compared to an open ocean albedo of \(<0.1\). Hence, as the Artic sea ice extent decline more incoming solar radiation is absorbed, potentially leading to warmer polar ocean water and a further decrease in ice extent. This is call the ice-albedo feedback, in which a change in the areal extent of sea ice leads to a change in the average albedo at high latitudes, which can lead to further changes in ice extent.
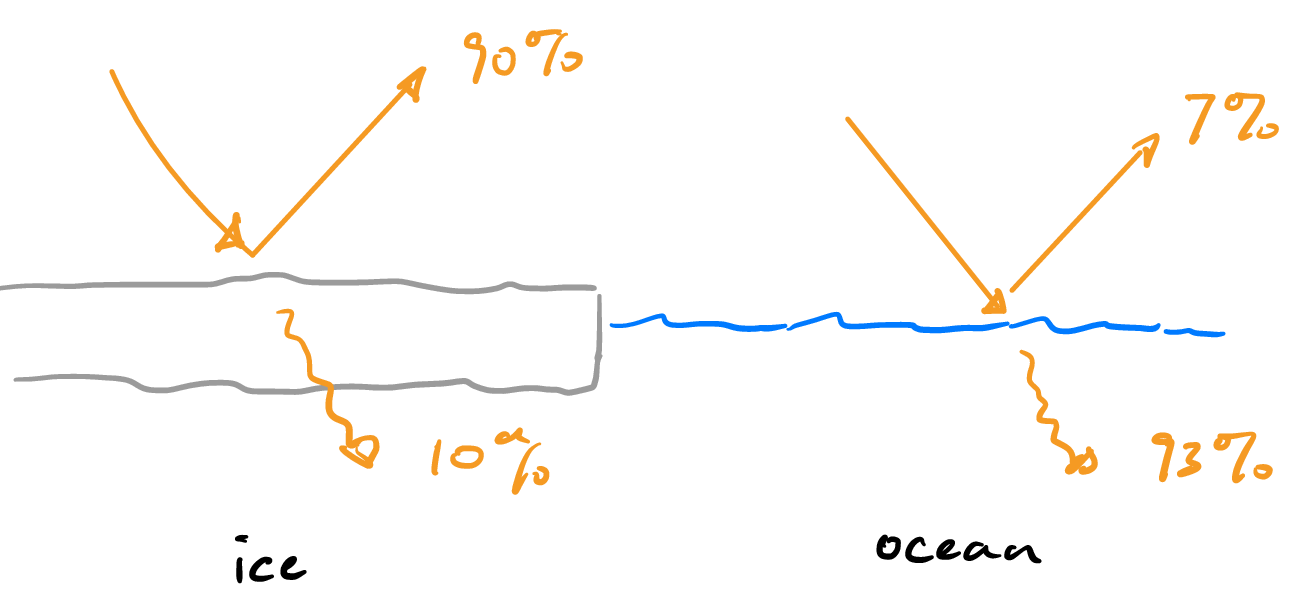
Fig. 3.6 Schematic of the ice-albedo feedback.#