8.4. Methane Sources#
One of the first things we can ask ourselves is why are the bottom-up emissions suggesting such a large source of methane from ‘other natural’ sources?
Much of this is that we are measuring directly high fluxes of methane related to hotspots of methane emissions, and then there may be something wrong with how we are extrapolating these, or they may be missed by satellites. Every day another 10-15 studies are published that discuss a methane hotspot or some environment that is releasing far more methane than we thought.
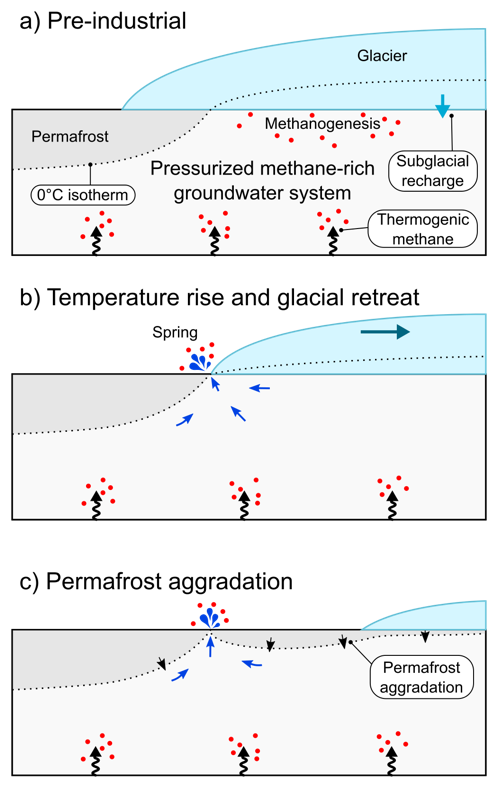
For example, Gabby Kleber in the department has been measuring methane coming out from springs formed from retreating glaciers and found that they are releasing a lot of methane – much more than that released by permafrost.
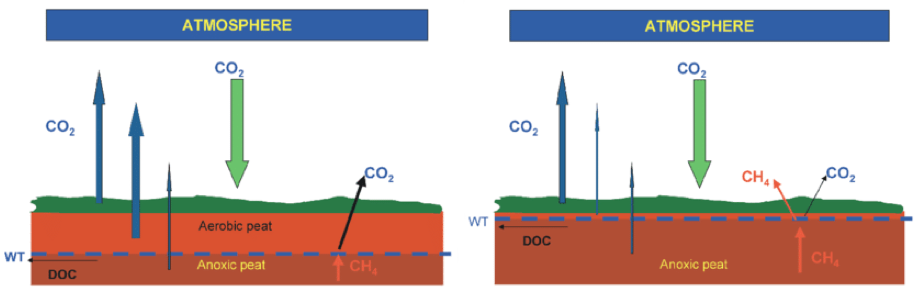
The other large issue is that we don’t necessarily understand the impact of our actions on methane production, and sometimes we do something to mitigate CO2 release but it has the unintended consequence of releasing more methane. There is currently a large project in the Fens studying greenhouse gas emissions from peat as a function of changes in the water table.
The basic premise is that peat, which formed during glacial retreat in flooded fields and valleys, is being exposed and oxidised to CO2. If we reflood the fields, or raise the water table then in theory the rate of oxidation will slow down dramatically. But what will happen to methane?
To constrain the depth dependent rate of methane production we need to use Fick’s second law. Fick’s first law is useful when concentrations are in steady state, and is useful to understand static flux measurements. Fick’s second law explores what happens to the concentration as a function of time and as a function of depth. This allows us to understand transient diffusion (as opposed to steady state diffusion) and allows us to constrain the depth-dependent rate of methane production and consumption.
To derive Fick’s second law (which is done in detail in the lecture), we take the derivative of Fick’s first law with respect to depth.
Here if we assume the diffusion coefficient (\(D\)) is not a function of depth, and we define depth in the positive direction going down in the soil, then this becomes
To this we can add chemical reactions (\(R_i\)) that make or destroy methane.
When we do this we find that in many studies, in soil-saturated wetlands, the rate of methane flux into a static chamber can be higher than the rate of methane production in the soil, and in places 10x higher (Shoemaker and Schrag, 2010).
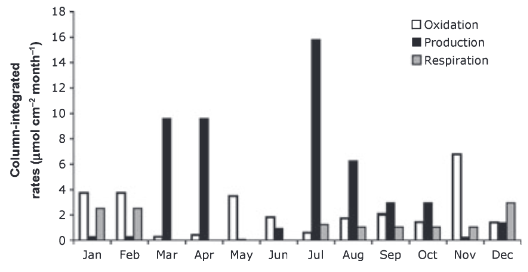
Fig. 8.31 Column-integrating rates of methane production, oxidation and respiration for each month. Values are monthly integrated and shown in units of μmol cm-2 month-1.#
This has been suggested to be due to the rapid production and consumption in water-logged soils at the surface, where aerobic bacteria can break down organic matter into small compounds that can fuel methanogenesis.
All together these two stories are part of a wide and growing body of literature that suggests that local variability in methane production and consumption, hot spots associated with methane release due to climate change, and a lack of understanding of where and how methane is being oxidised lead to great uncertainties in the overall methane budget.
Moving away from methane, we can consider other ways that the land surface impacts climate. Back in Air Pollution we discussed the role of NOx in generating ozone. Another class of compounds that also generates ozone are volatile organic compounds (these also make up a lot of the particulate matter that is so harmful to human health). Because of the nature of photolysis of these compounds and their ability to make ozone, it has long been recognised that at low VOC concentrations, ozone production is strongly dependent on the concentration of VOC, while at low NOx concentrations, it is strongly dependent on the concentration of NOx. This is shown in the figure below as the ‘VOC’ and ‘NOx’ limited parts of ozone production, with the lines of equal ozone production called ‘isopleths’.
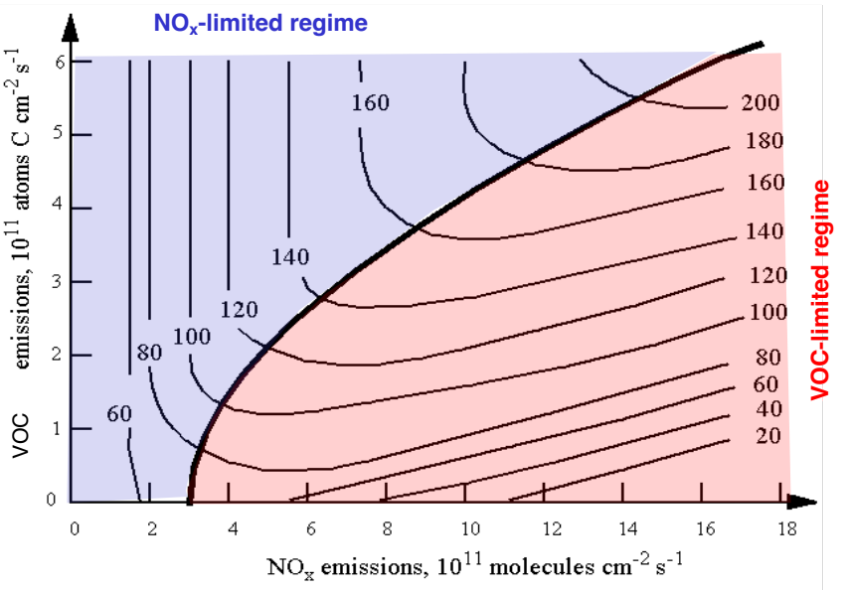
Based on emissions in the USA, it was thought that the country was in the VOC-limited part of this graph. So there was great effort in the 1990’s and 2000’s to reduce VOC emissions, with little effort to reduce NOx as it was thought not to have as much of an impact. But there was no decrease in ozone.
Plants emit many volatile organic compounds, for example isoprene (>50% of biogenic VOC emissions). Which react quickly to form formaldehyde. Satellite maps of formaldehyde concentrations over the US show that the US has massive amounts of biogenic VOC emissions. When this is taken into account, the country is in the NOx limited regime and to reduce ozone should focus on NOx emission reductions. Indeed, the background biogenic VOC concentration is so high that focusing on NOx reductions makes sense anyway.


The final thing to note is that the land surface plays a large role in amplifying heat waves and climate change. This is shown in the schematic below. When soil moisture is high, there is a large latent heat flux from the land to the atmosphere, and this causes clouds, which lead to precipitation, which keep the soil moisture high. When soil moisture declines, then the land emits more of the sensible heat flux, which produces a deeper, drier atmosphere, which enhances the overall dryness and exacerbates the heat wave. These dry periods also greatly impact the storage of carbon in the soil, as oxygen gets into the soil and produces CO2.
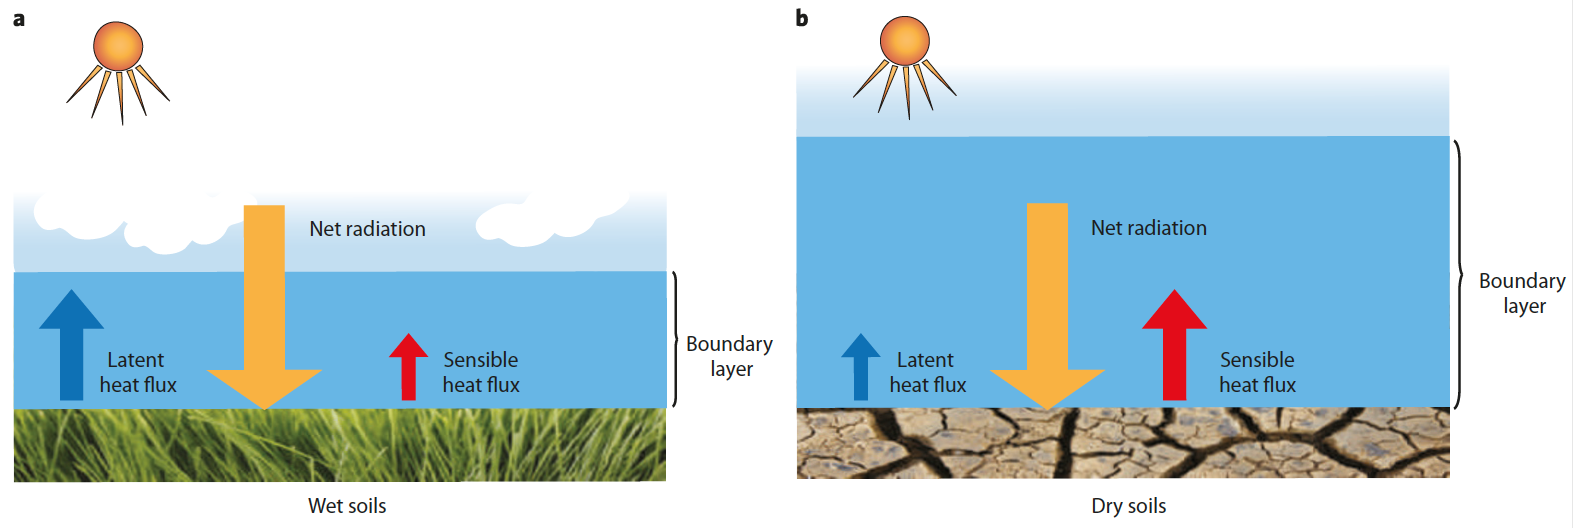
Fig. 8.32 schematic of the net raditation budget at the land surface. a) In areas with high soil moisture, the latent heat flux by evapotranspirtation and transpiration dominates, enhancing cloud formation and a tendency for cooling. b) By contrast, if the soil moisture deficit is high, the dry soils raise the sensible heat flux, producing deeper, warmer, drier, low-level atmosphere. This process inhibits convection and cloud formation and creates a positive feedback loop.#
In conclusion, below is the figure from the IPCC which allows you to consider the role that various types of land surface play in storage of carbon, production of methane or other trace gases, and release of these to the atmosphere.
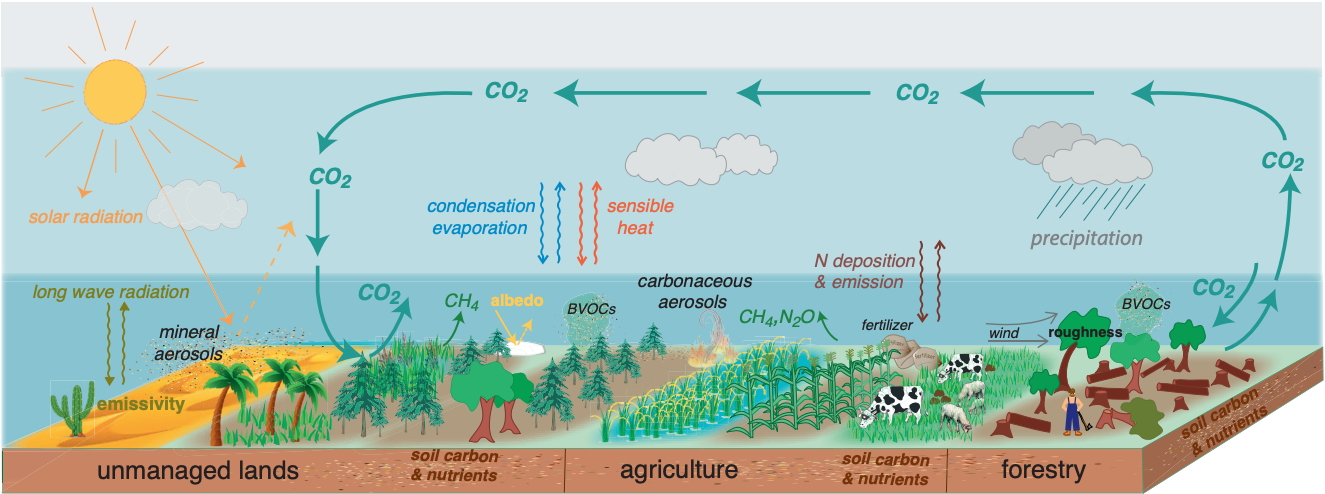
Fig. 8.33 The structure and fucntioning of managed and unmanaged excosystems that affect local, regional, and global climate. Land surface characteristics such as albedo and emissivity determine the amount of solar and long-wave radiation absorbed by land and reflected or emitted to the atmosphere. Surface roughness influences turbulent exchanges of momentum, energy, water and biogeochemical tracers. Land ecosystems modulate the atmospheric composition through emissions and removals of many GHGs and precursors of SLCFs, including biogenic volatile organic compounds (BVOCs) and mineral dust. Atmospheric aerosols formed from these precursors affect regional climate by altering the amounts of precipitation and radiation reaching land surfaces through their role in clouds physics.#