8.2. The Methane Cycle#
Why Methane?#
After CO2, methane (CH4) is the second most important long lived greenhouse gas contributing to human-induced climate change. For a time horizon of 100 years, methane has a Global Warming Potential 28 times larger than CO2.
What is Global Warming Potential? The global warming potential of a gas depends on two things: how effective the gas is at trapping heat in the atmosphere, and how long it stays in the atmosphere before it breaks down. Methane breaks down quite quickly, the average methane molecule stays in the atmosphere for around 12 years, while the average CO2 molecule lasts much longer. However, methane traps heat more effectively than CO2.
Global Warming Potential allow us to answer the question: if 1kg of a particular greenhouse gas traps a certain amount of heat, how much CO2 would trap the same amount? The 100 year global warming potential of methane is 25, therefore if 1 kg of methane was released into the atmosphere, it would create the same warming as 25 kg of CO2. This is often described as 25 tonnes CO2e, where ‘e’ stands for equivalent.
Thus Methane is responsible for 20% of the direct global radiative forcing by all human-regulated greenhouse gases so far. Methane concentrations in the atmosphere have increased 2.5x versus preindustrial levels. Methane also contributes to the formation of tropospheric ozone (remember back to Atmospheric Chemistry lectures in Michaelmas), and methane oxidation contributes to water vapor in the stratosphere.
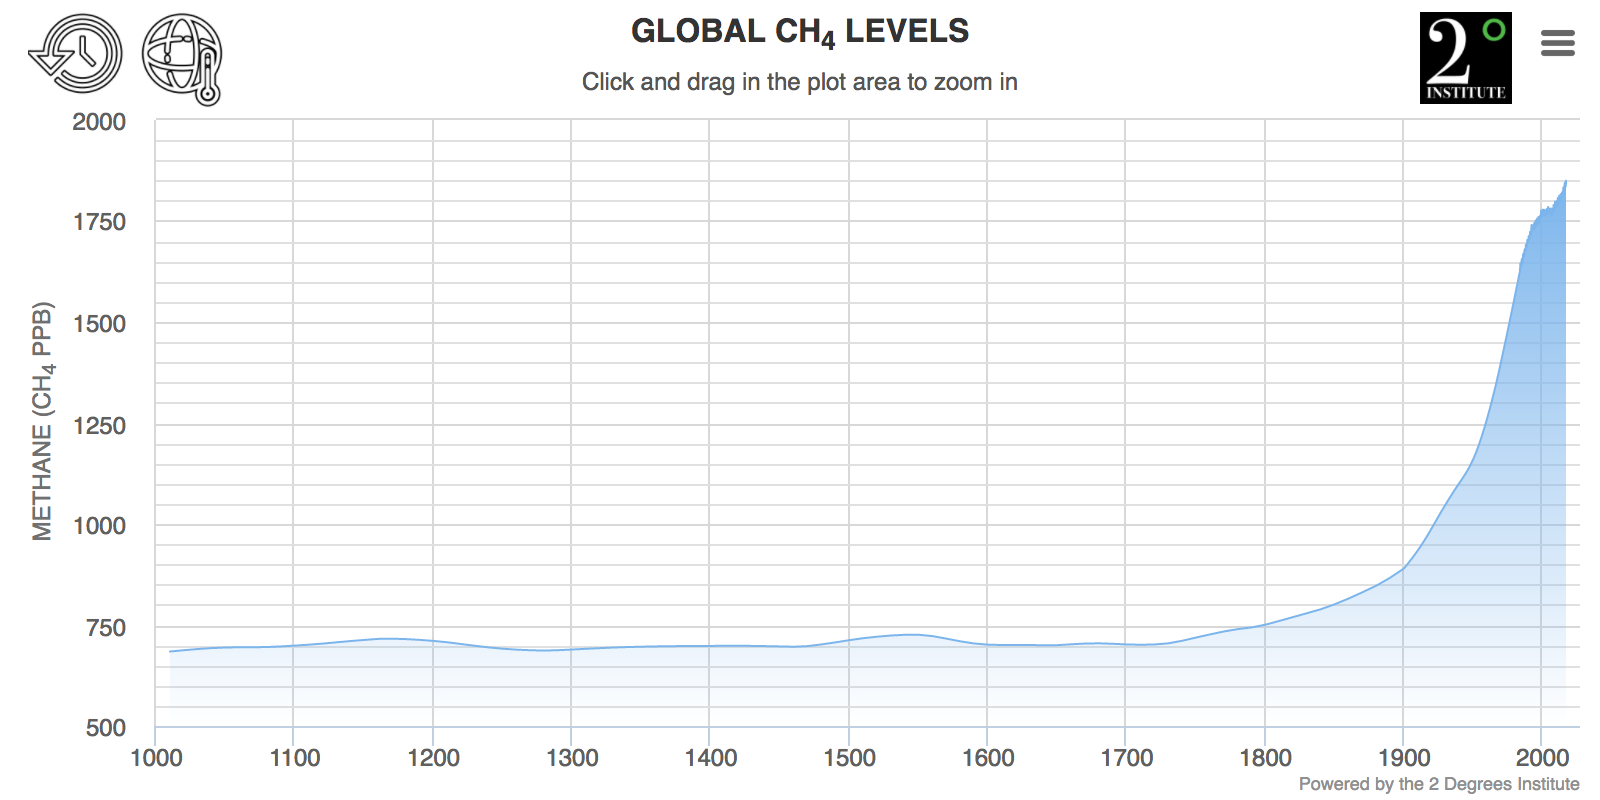
Fig. 8.10 Global methane levels over the past ~1000 years.#
When we look at the record of methane concentrations in the atmosphere over the last 20-30 years in higher resolution, and we look at the variability in methane concentrations around the globe we notice a few key things.
First, there is significant annual variability in the methane concentration (Fig. 8.11. Second, there is a large difference in the methane concentration between the northern and southern hemisphere. Third, there was a pause in the increase in methane concentrations from around 2000-2006. The pause in the increase in methane concentrations is something that really confused many scientists.
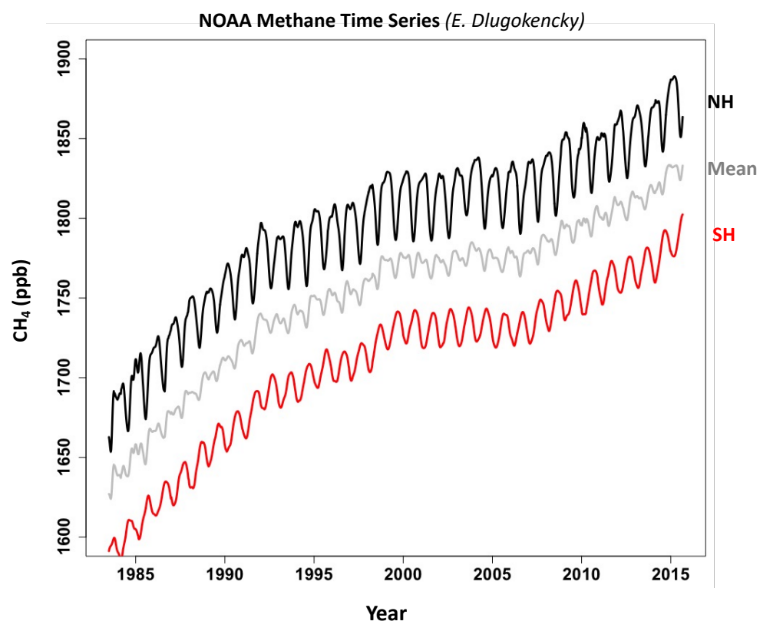
Fig. 8.11 A higher-resolution record of methane concentrations over the past ~30 years.#
Methane#
We talk about methane emissions in units of TgCH4 yr-1 – there are 2.78 Tg CH4 per ppb of methane.
Bond Strength |
440 kJ mole-1 |
Boiling Point |
-164 ℃ (similar to N2 (-195.8 ℃)) |
Heat of Combustion |
891 kJ mole-1 - 55.7 kJ g-1 (more heat per mass than any other hydrocarbon) |
Solubility in water |
22.7 mg L-1 (less than O2 (40 mg L-1)) |
Methane makes a powerful greenhouse gas because it absorbs in an atmospheric window where other gases don’t absorb and because of its longer lifetime in the atmosphere (Fig. 8.12).
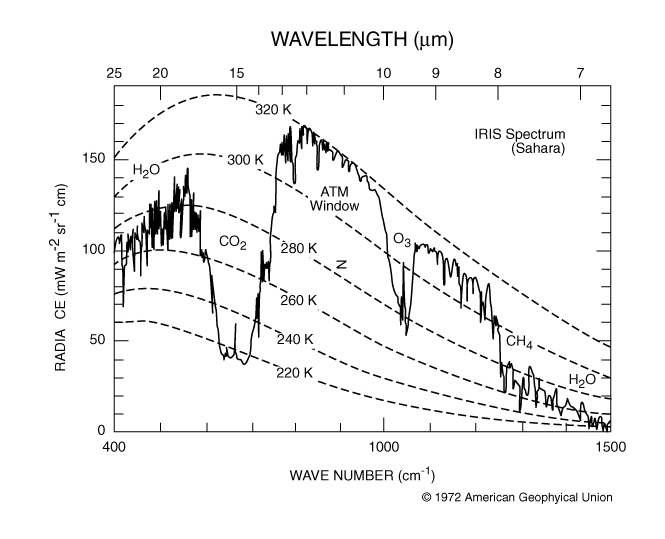
Fig. 8.12 The absorption spectrum of air - the absorption of methane is at a wavenumber of ~1300 cm-1, which is in in a region where other gases don’t absorb.#
Methane Production#
There are two main pathways for methane production, broadly termed methanogenesis: microbial methanogenesis and thermogenic methane.
Microbial Methanogenesis: microbial anaerobic (no oxygen) respiration and the product is methane. The best described pathways use as terminal electron acceptors acetic acid, in an auto-redox process, or CO2, with H2 as reductant:
There is growing recognition that methylotrophic pathways are also very important producers of methane (e.g. consuming methyl-containing organic matter and not just acetate). Methanogens are typically Archaea. Relatively few species (30-40), but highly diverse. They are also highly specialized in terms of food sources – Can only use simple compounds (1 or 2 carbon atoms), and many species can only use 1 or 2 of these simple compounds. Therefore, Methane production is highly dependent on other organisms for their substrates (there isn’t much free hydrogen or acetate just lying around). This creates a sub-Earth food web/consortium (Fig. 8.13).
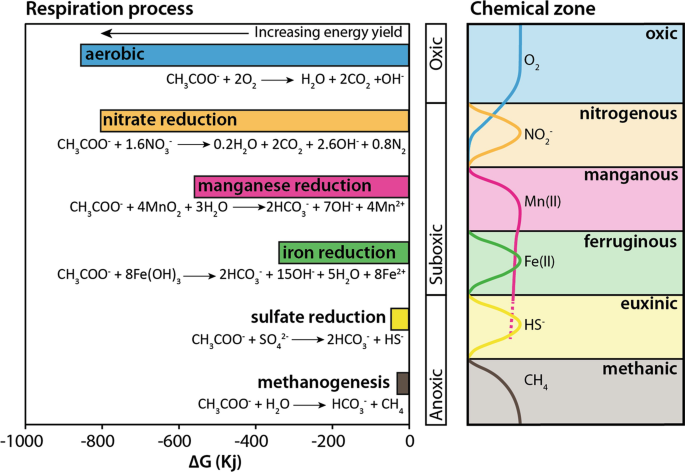
Fig. 8.13 Microbial methanogenesis happens when all other oxidants (e.g. oxygen, nitrate, manganese, iron, sulfate) are depleted and if there is still hydrogen and organic compounds around. This is because microbial methanogenesis is so energetically unfavorable relative to other microbial metabolisms.#
In contrast, thermogenic methane comes from the heating of organic matter, which breaks down the organic molecules and often releases methane as a gas. This can be due to organic matter being buried to a great depth, or can be due to forest fires, or other fires of soil where organic carbon gets cooked. When thermogenic methane is released it can often be recognised as other short chained hydrocarbons are released with it.
Methane Consumption#
The oxidation of methane can happen microbially, or through combustion (e.g. burning), and through photochemical oxidation in the atmosphere.
Microbial Methane Oxidation (also called methanotrophy) can happen with or without O2 – With O2 we call it Aerobic Methane Oxidation, which is carried out by Methane Oxidizing Bacteria.
Methanotrophs: Prokaryotes (bacteria and archaea) using only C1 compounds. We find aerobic methanotrophy happening in a lot of environments including in soils.
Without O2 we call this anaerobic methane oxidation. Initially this was linked to sulfate
due to the highly coupled behavior of methane and sulfate in marine sediments. However in the last 15 years, anaerobic methane oxidation has also been coupled to nitrate, manganese, iron and other ‘electron acceptors’ (Fig. 8.14).
Anaerobic oxidation processes prevent most CH4 produced in marine systems (sediments, anaerobic basins, salt marshes) from coming out into the atmosphere.
Aerobic oxidation likewise consumes a large fraction from freshwater environments and terrestrial soils.
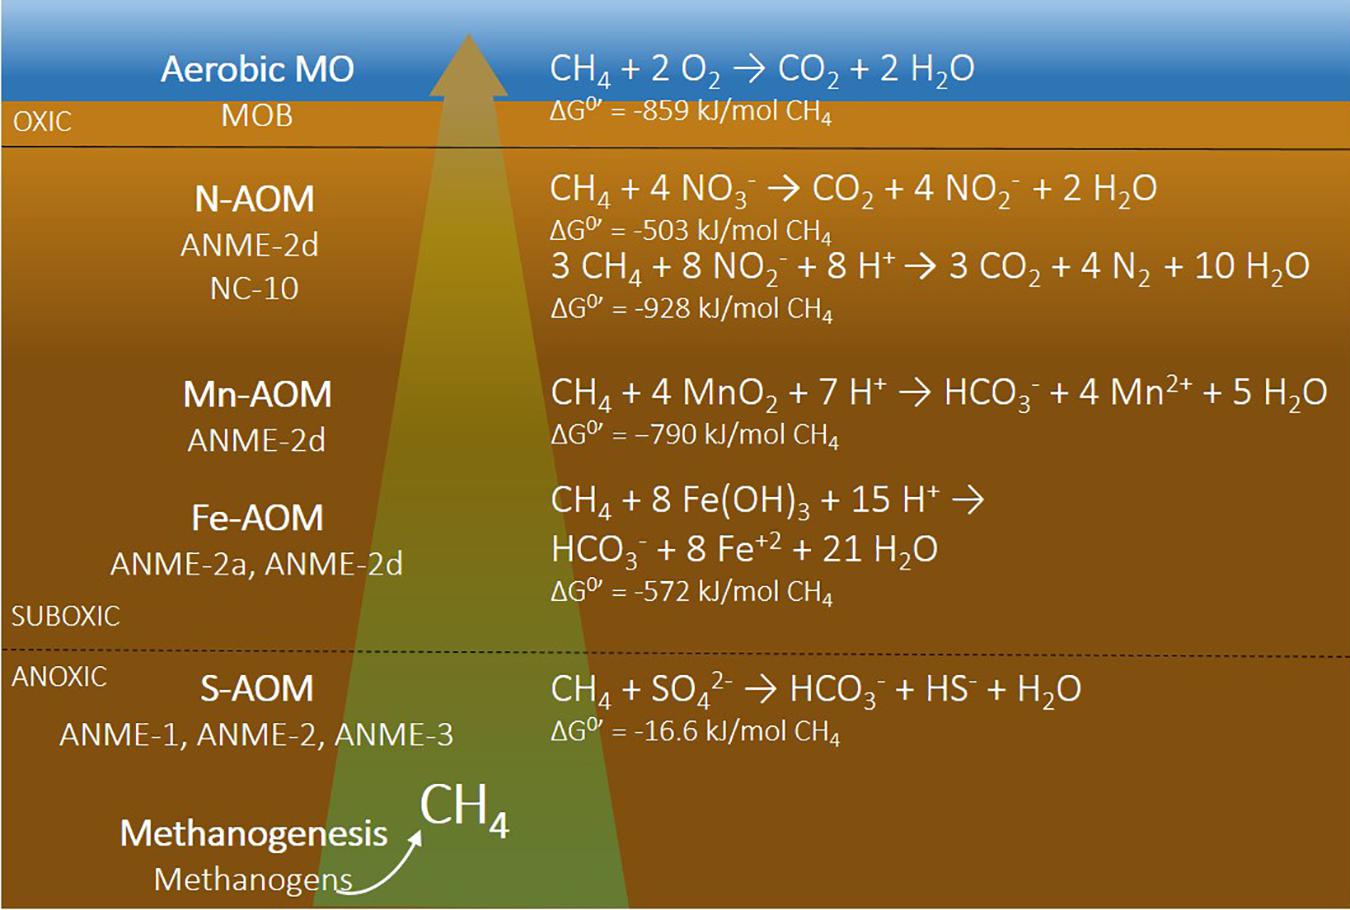
Fig. 8.14 The chemistry of methane anaeroic oxidation.#
Oxidation of methane in the atmosphere involves a chain series of reactions that also produce ozone (O3) via NOx – as we discussed in Michaelmas term. The chain reaction is set up by the oxidation of methane by OH radicals. The net chemical reaction is:
And the chemical reaction chain is in Fig. 8.15.
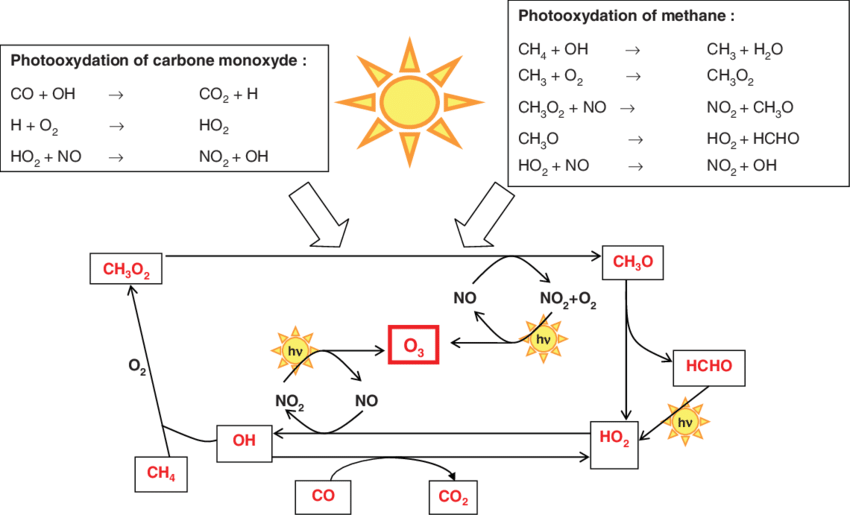
Fig. 8.15 The oxidation of methane in the atmosphere.#
The Methane Cycle#
If we put this all together we have a series of sources and a series of sinks, but many of the sources and sinks are both underground. Methane produced underground (as much of it is), has to then get above ground to contribute to the atmospheric burden of methane.
Oxygen strongly inhibits the growth of methanogens. To be strong emitters of CH4, sediments need to be anoxic and well supplied with labile organic matter (carbohydrates).
Methane produced in soil will be efficiently oxidized in overlying water or aerobic soil.
Methane in freshwater sediments can build up sufficient pressure to be released as bubbles. To reach the atmosphere, the methane in these bubbles needs to get to the surface without dissolving, because methane that is dissolved will be oxidized in the water column.
Methane in soil can escape to the atmosphere via air channels in the stalks of emergent vegetation (e.g. rice).
Methane can also just stay in the soil or sediment. In certain pressure and temperature conditions it can freeze into ice, forming a methane clathrate, or methane hydrate (Fig. 8.16). This is how much methane is trapped in permafrost. The issue is that as the climate warms, the methane is released from the permafrost, warming the atmosphere, which then changes the temperature again and the stability field for methane hydrates, potentially leading to a positive feedback loop.
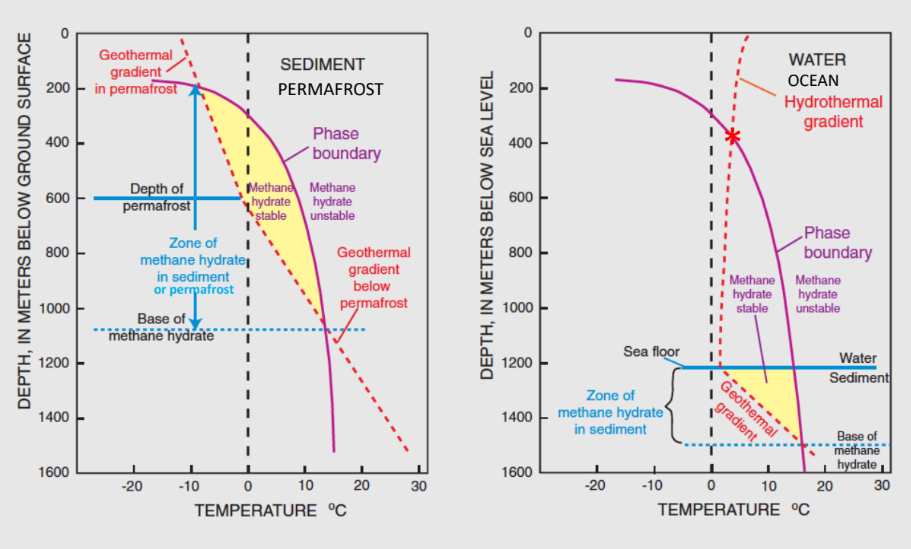
Fig. 8.16 The conditions where methane clathrates are stable.#
Overall, only about 1-5% of the methane made and stored in the subsurface gets to the atmosphere. In spite of it being (by far) the largest location of production of methane (Fig. 8.17).
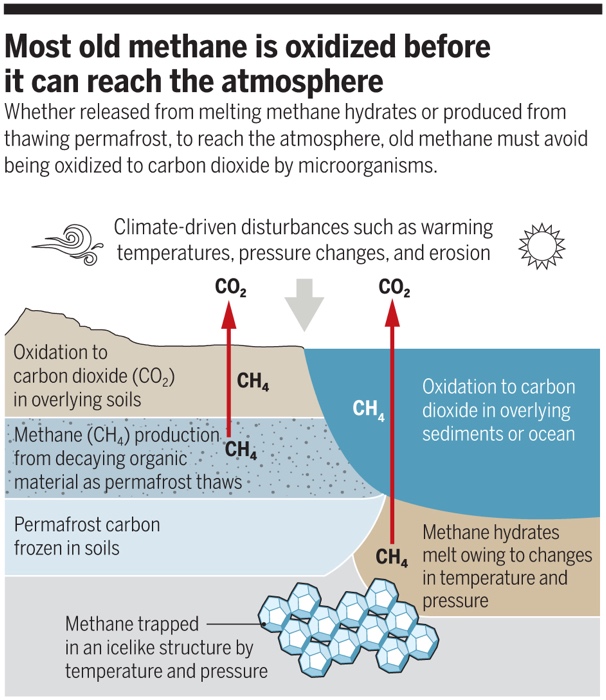
Fig. 8.17 The processes of methane oxidation are efficient, and only 1-5% of methane produced in the subsurface makes it to the atmosphere.#
When we consider the global emissions of methane, we can see where they are largely coming from (agriculture, wastewater, landfills, oil and gas). About 1/3 of methane emissions are from natural causes (oceans, termites, wetlands) but these are accelerating under increased temperatures speeding up microbial activity (Fig. 8.23).
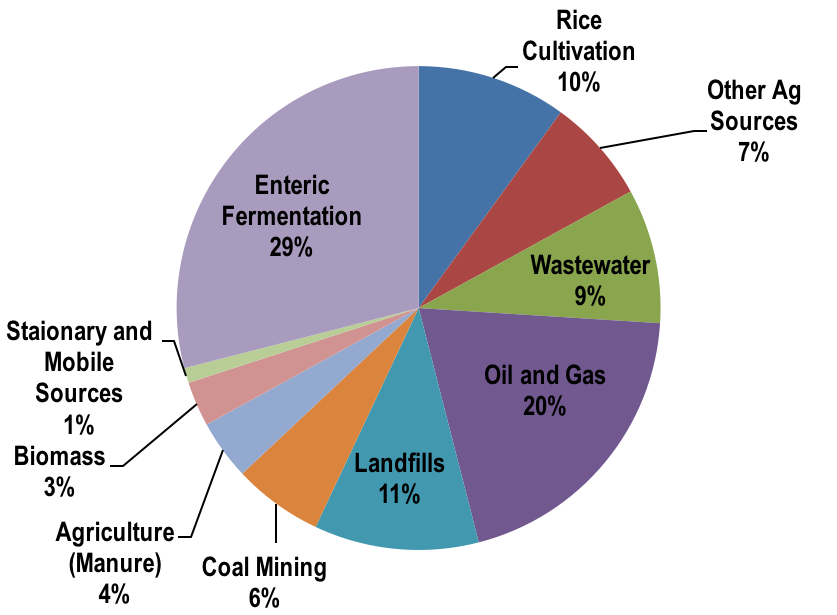
Fig. 8.18 A breakdown of methane emissions by source.#
We started this discussion thinking about the increase in methane in the atmosphere, why there is seasonal variability, why it is so different in the northern hemisphere and the southern hemisphere, and why there was a pause in the increase between 2000 and 2006. This lecture we have considered the sources and sinks of methane, and can understand that there is seasonal variability in agriculture (growth of the growing season), and this is concentrated in the northern hemisphere. This explains both the seasonal trend and the hemispheric difference.