6.1. Introduction#
In this section, we will discuss the dynamics (the movement of air and water) in the atmosphere and ocean and the role that this movement plays in the climate system. The atmosphere and ocean store and transport vast amounts of heat and carbon. The movement of air and water helps to maintain habitability of the earth. Understanding these dynamics is critical to predicting the fate of the planet in a changing climate.
We have discussed fluid motion in other contexts already in the course. Unlike the flows that we have encountered thus far, fluid motion in the ocean and atmosphere is strongly influenced by the rotation of the Earth. As we will see, the influence of the earth’s rotation on the fluid motion has interesting and counter-intuitive effects. Before we look at the equations governing atmosphere and ocean dynamics, we will examine the distribution of heat and carbon in the atmosphere and ocean.
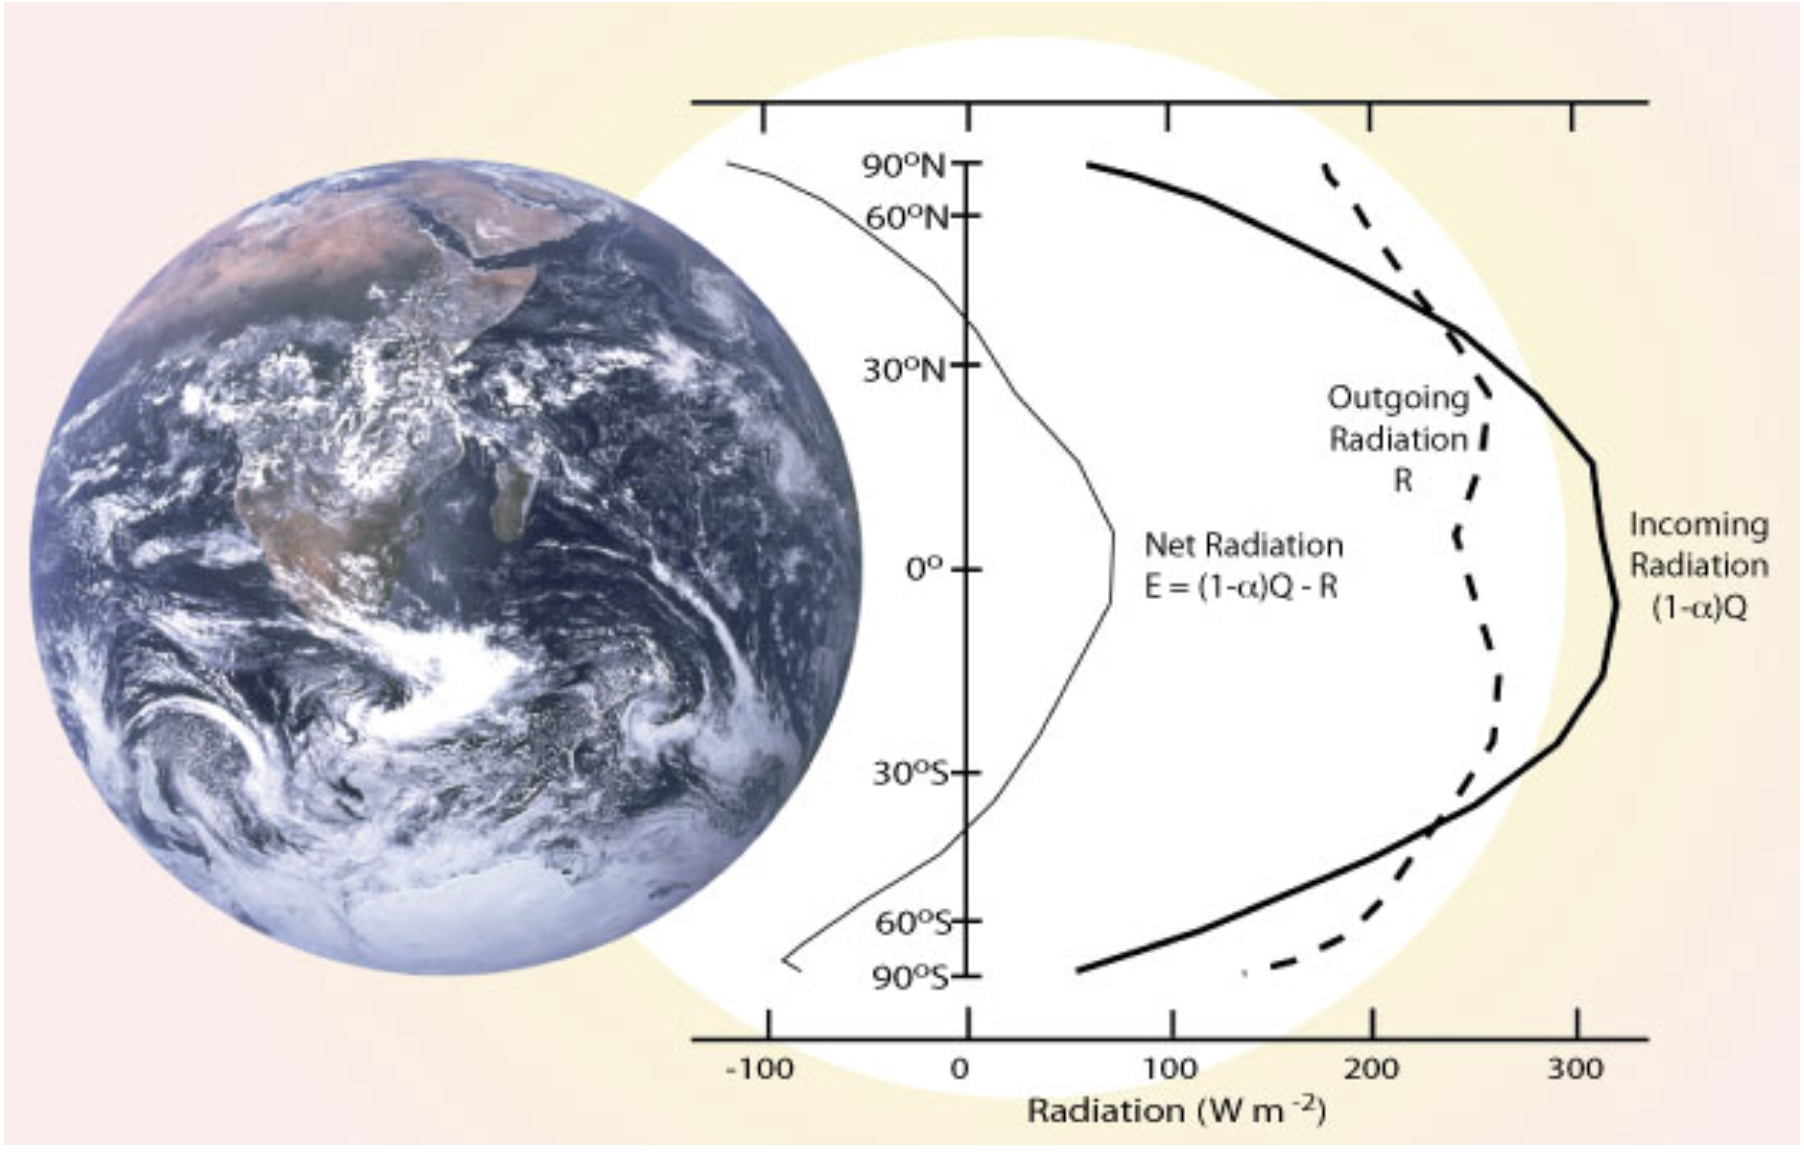
Fig. 6.1 Distribution of incoming and outgoing radiation and their difference (net). From seaos-project.org#
Fig. 6.1 shows the distribution of the incoming and outgoing radiation as a function of latitude, averaged in time and longitude. The net radiation (incoming minus outgoing) is also shown. The incoming radiation exceeds the outgoing radiation by nearly 100 W/m\(^2\) at the equator, with a similar deficit near the poles. However, movement of air and water in the atmosphere and ocean transport heat from the tropics to the poles, compensating for the imbalance in the net radiation.
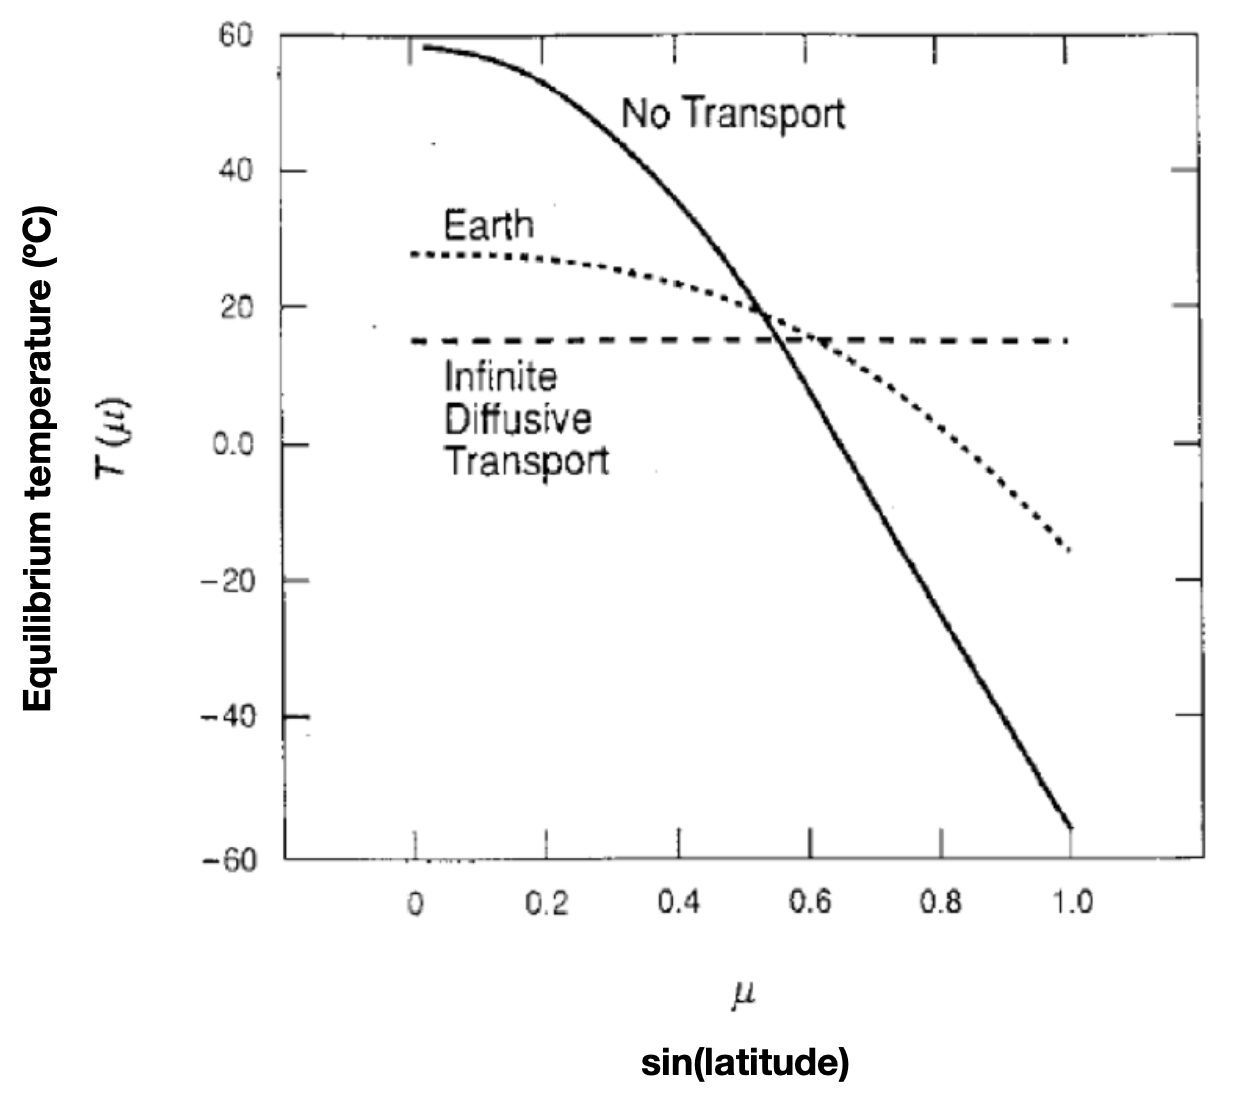
Fig. 6.2 Equilibrium surface temperature as a function of sin(latitude) for the Earth and two hypothetical scenarios. From North et al. 1981.#
Without any heat transport, the net radiation imbalance would cause the tropics to heat up and the poles to cool down until the earth surface reached a new equilibrium temperature. The hypothetical equilibrium temperature without any heat transport is shown as a function of the sine of latitude in Fig. 6.2. For comparison, the actual mean Earth temperature is shown as a dotted line. Cambridge sits at about \(\mu=0.79\) where the equilibrium temperature without heat transport would be less than \(-20^\circ\)C! We should be very grateful for atmosphere and ocean dynamics! In the opposite extreme of infinitely fast transport, the earth’s surface would have a uniform temperature which is indicated in the horizontal dashed line.
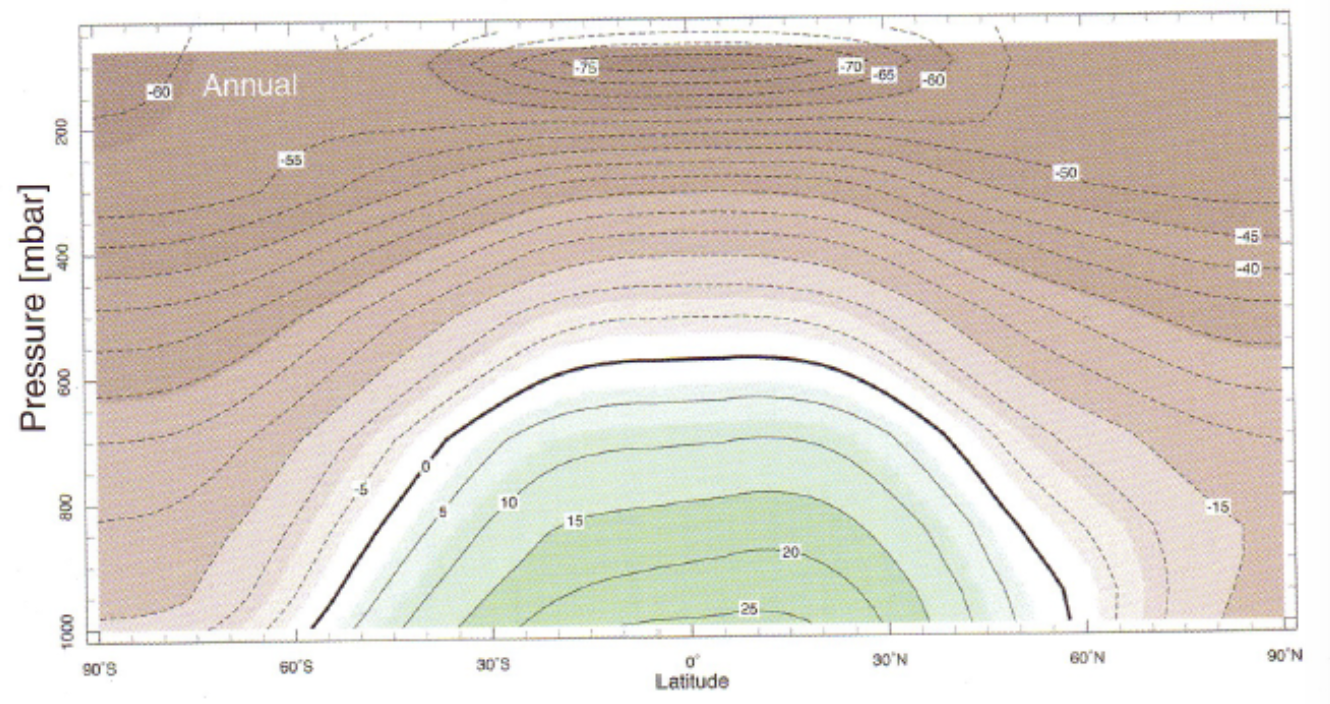
Fig. 6.3 Mean atmospheric temperature, averaged in longitude and in time. From weathercliamtelab.mit.edu#
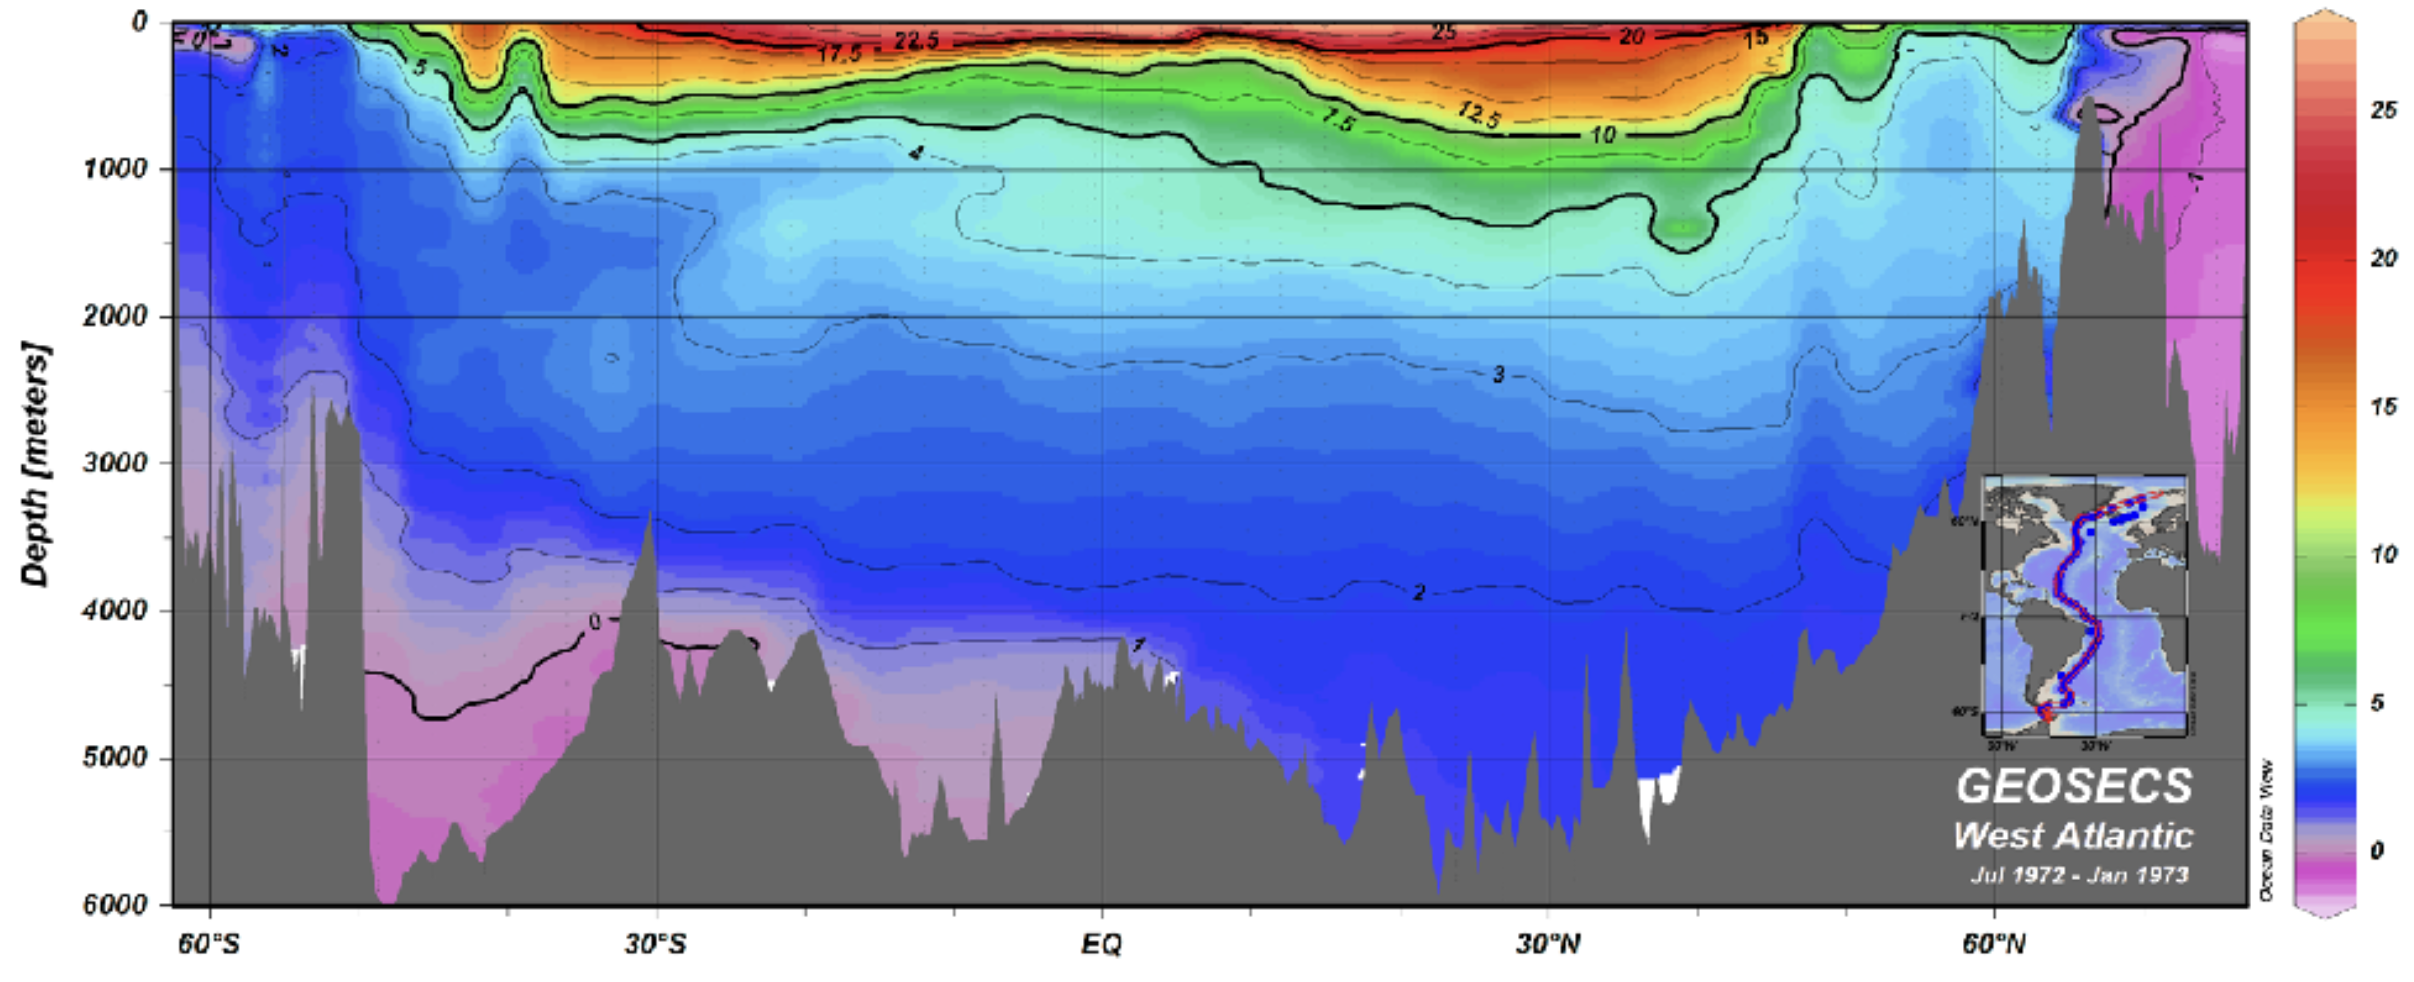
Fig. 6.4 North/South section of temperature from the Altantic Ocean in degrees C. From eWOCE.org#
Fig. 6.3 shows the annually-averaged temperature in the atmosphere, averaged in longitude as a function of latitude and height. Similarly, Fig. 6.4 shows a section of temperature across the North Atlantic as measured from a ship (note that this is not averaged). As we might expect, the mean temperature is highest in the tropics and near the Earth’s surface in both the atmosphere and ocean.
There are significant gradients in temperature with latitude and height in both the ocean and atmosphere. At the Earth’s surface the cold air and water near the poles is significantly more dense than the corresponding warm air/water in the tropics. We might wonder what maintains this equilibrium; if the air near the poles is colder and denser than the air elsewhere on the earth’s surface, why doesn’t the cold dense air spread out to lower latitudes? As we will see, large-scale horizontal density gradients in the atmosphere and ocean are balanced by currents of air and water associated with the Coriolis acceleration.
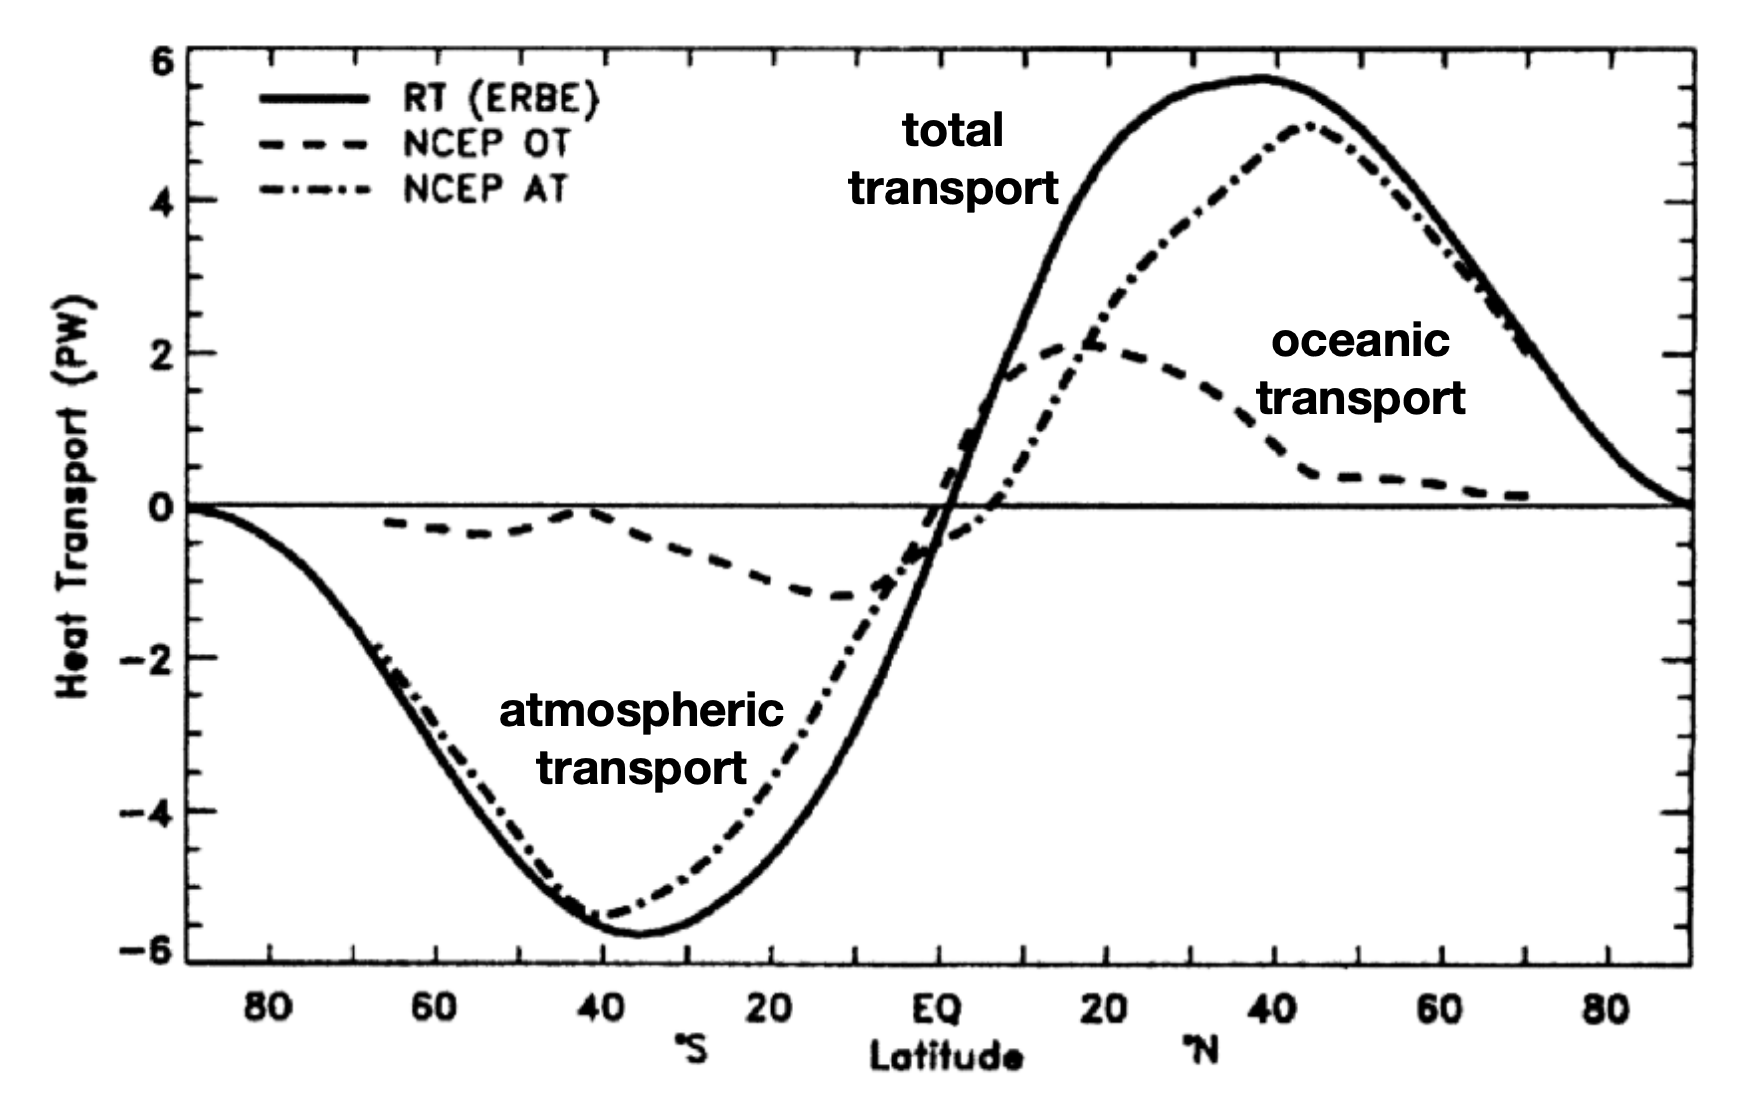
Fig. 6.5 North/south advective heat flux with atmospheric and oceanic contributions. From Wunsch 2005.#
The imbalance in the net radiation is compensated by a poleward transport of heat due to the movement of air and water - an advective heat flux. Part of the advective heat flux is associated with winds in the atmosphere and part by ocean currents. Fig. 6.5 shows the total north/south (or meridional) heat transport and the portion due to motions in the atmosphere and ocean.
The atmosphere transports more heat overall, but the ocean still transports a significant amount of heat, particularly at low latitudes. The two transport mechanisms are coupled - e.g. heat transported by the ocean could be released to the atmosphere which could then provide further poleward heat transport. As we will discuss later, the atmospheric heat transport is largely associated with eddies (e.g. storm systems), while the oceanic heat transport is largely associated with the mean (time-averaged) circulation.
In addition to its heat transport, the ocean plays a central role in the earth’s climate system by acting as a massive reservoir for heat and carbon. The heat capacity of seawater is about 4000 J/kg/\(^\circ\)C, meaning that it takes about 4000 Joules to heat 1 kg of seawater by 1\(^\circ\)C. By comparison, the heat capacity of dry air is about 1000 J/kg/\(^\circ\)C. The difference in the volumetric heat capacity is much more dramatic since the density of water is about 1000 times larger than the density of air. The mass of the atmosphere is about \(10^4\) kg/m\(^2\). Therefore, the upper 2.5m of the ocean has the same heat capacity as the entire atmosphere above it. When we consider that the ocean is several kilometers deep, we see that the heat capacity of the ocean vastly exceeds that of the atmosphere.
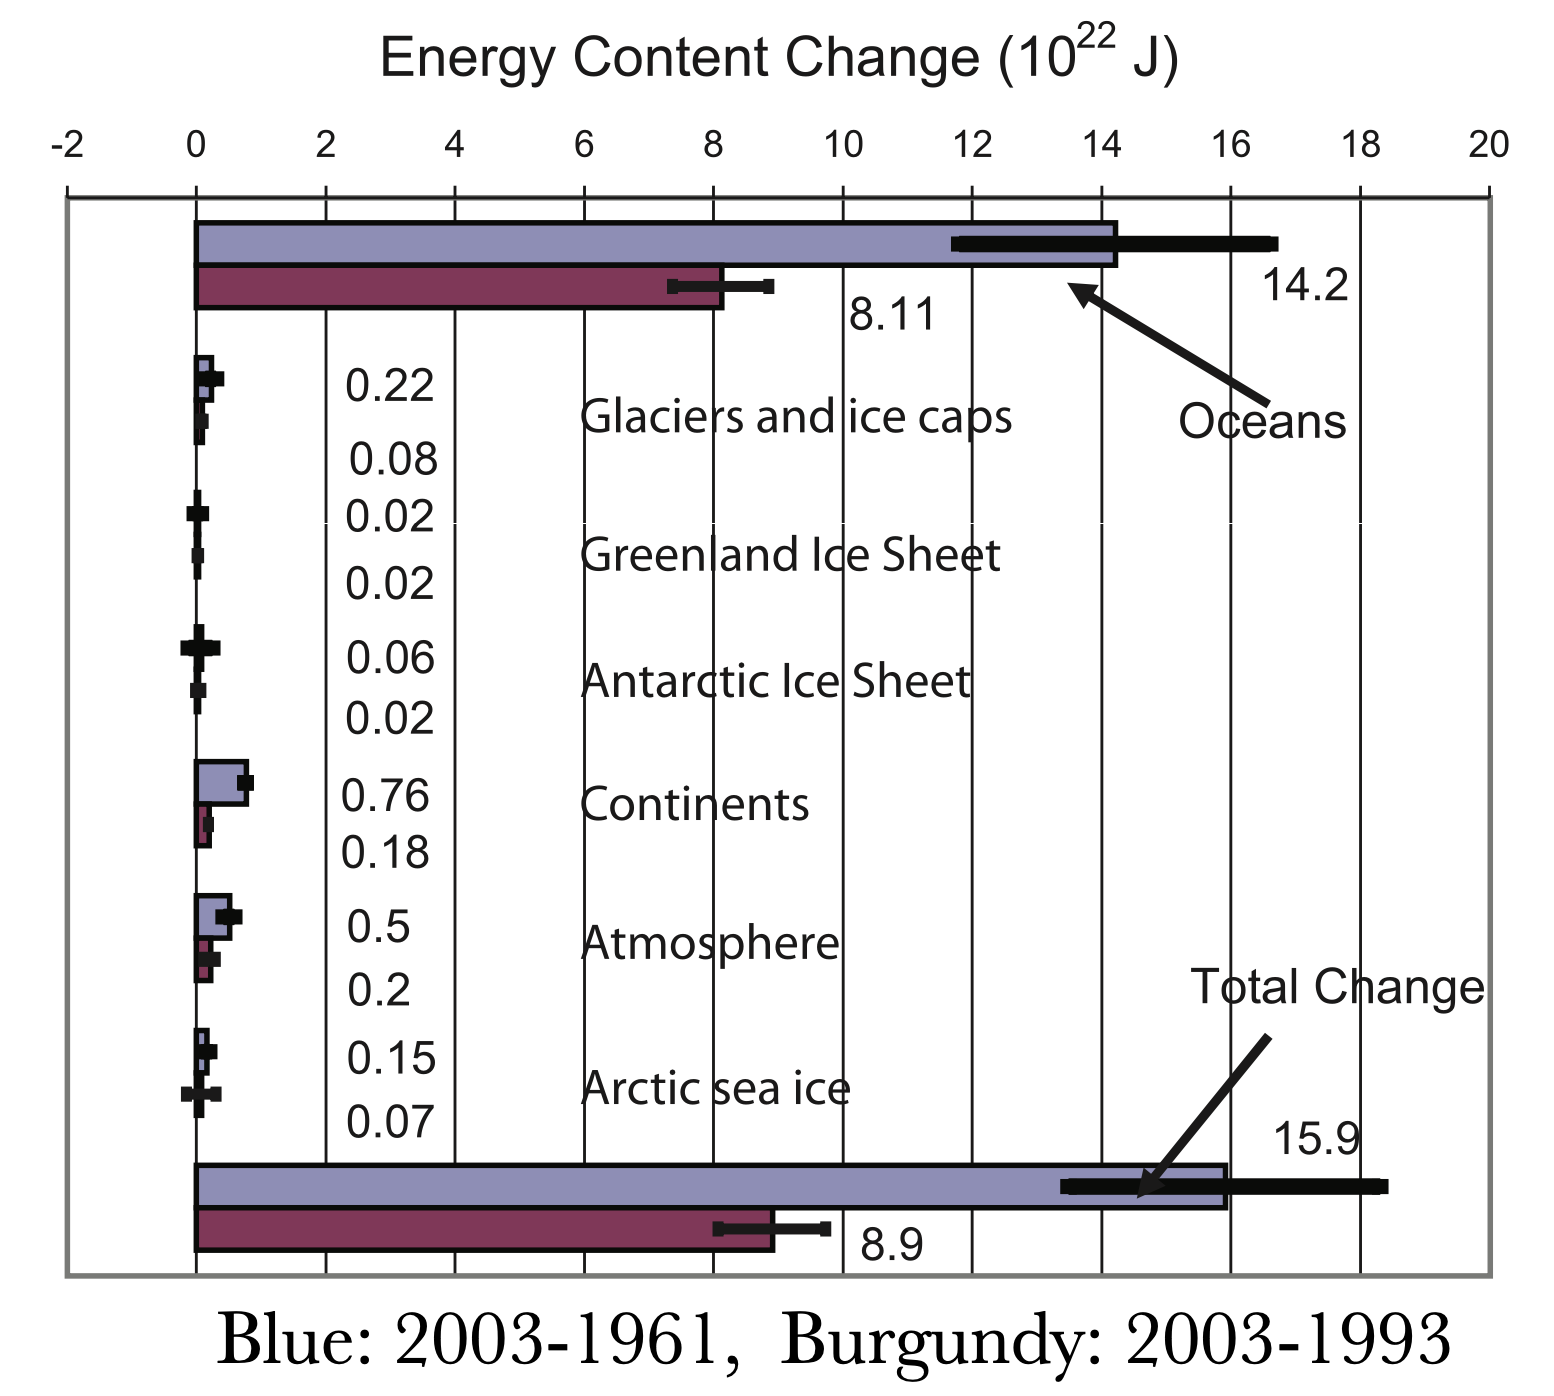
Fig. 6.6 Change in heat energy contained in various components of the earth system. From Bindoff et al. 2007 and IPCC AR4.#
Fig. 6.6 shows the change in heat energy during two periods. While we are all familiar with the warming trend in the atmosphere over this period, the ocean accounts for the vast majority of the increase in heat. This of course does not imply that the other components of the climate system are not important (e.g. melting of ice sheets contributes to sea level rise and melting Arctic sea ice changes the planet’s albedo).
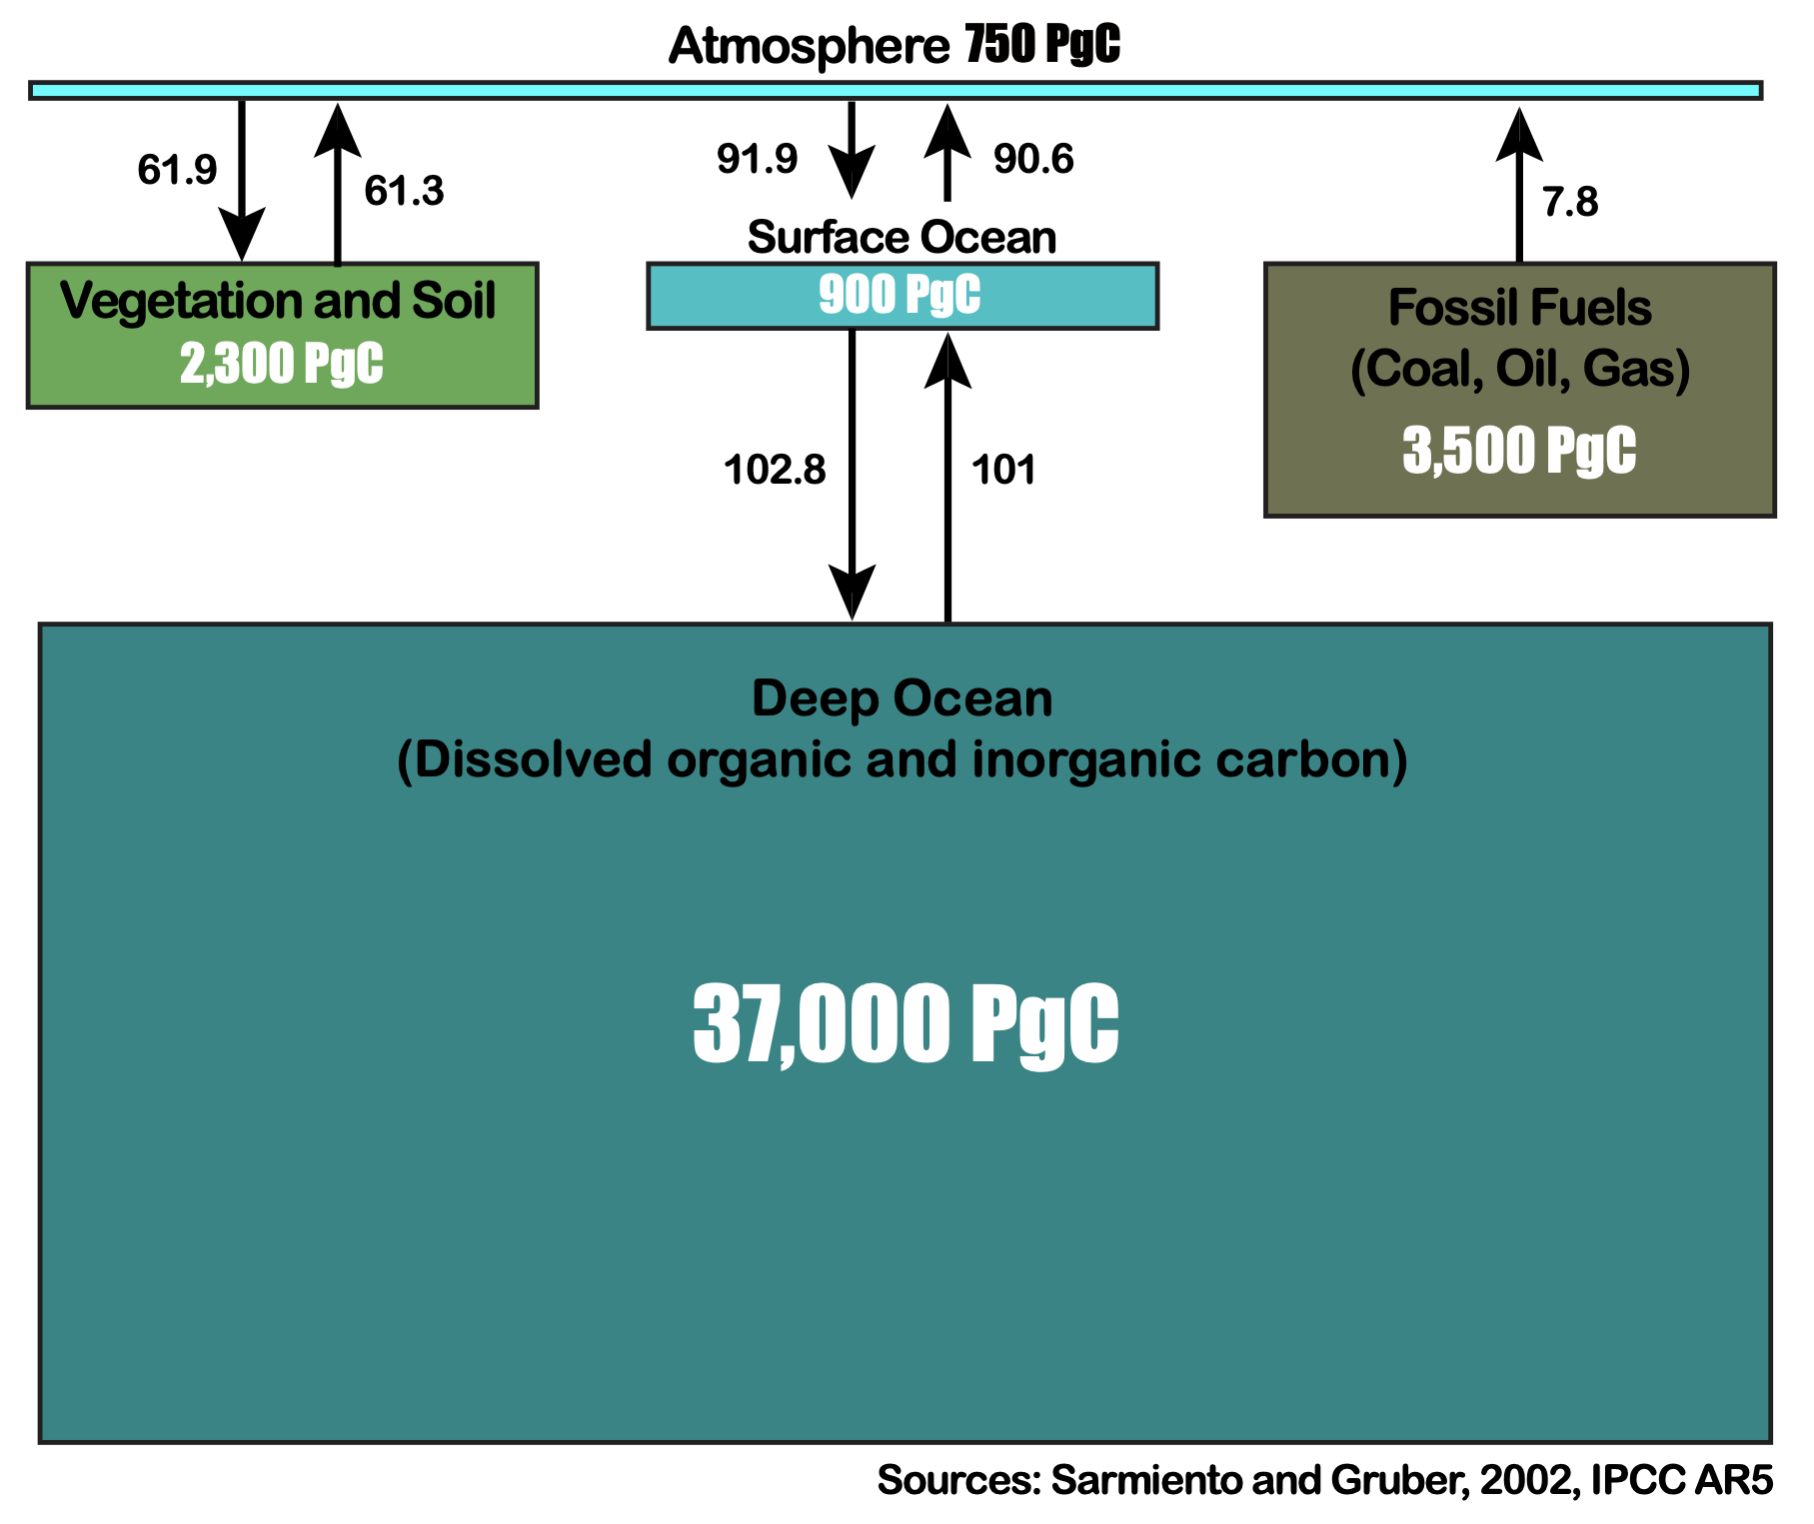
Fig. 6.7 Non-geologic carbon reservoirs (boxes) and fluxes (arrows).#
The ocean is also the largest non-geological carbon reservoir on the Earth. This is illustrated in Fig. 6.7 where the amount of carbon in each component is labelled in Petagrams (1 Pg = \(10^{15}\) grams) and the area of each box is proportional to the amount of carbon. Arrows indicate carbon fluxes which are labelled in Terragrams (1 Tg = \(10^{12}\) grams) of carbon per year. Most of the carbon emitted through the burning of fossil fuels is accumulating in the atmosphere, but some of this human-emitted (anthropogenic) carbon has also been stored on land in vegetation and soils, and in the ocean.